Figure 2.

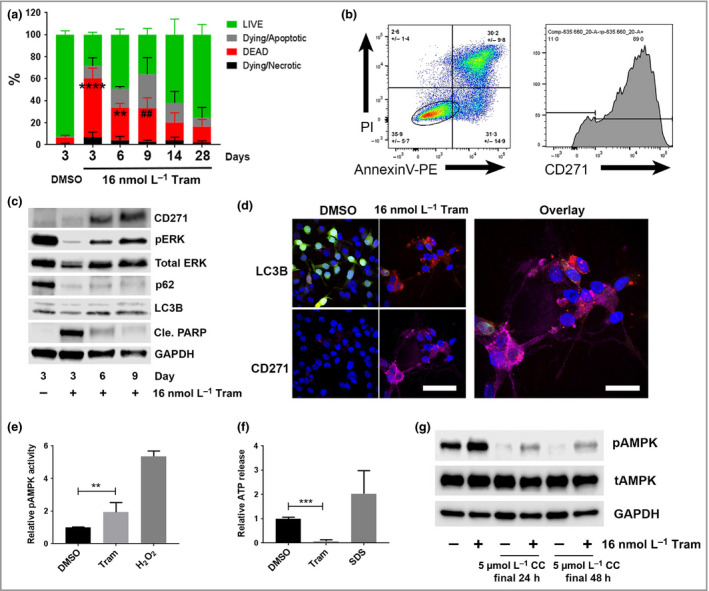
Trametinib induces CD271 expression and autophagic activity in melanoma cells in vitro. (a) Flow cytometry of AnnexinV–phycoerythrin (PE)/propidium iodide (PI)‐stained A375 melanoma cells for percentage live, dead, dying/apoptotic or dying/necrotic cell fractions in the presence or absence of treatment with 16 nmol L−1 trametinib (Tram) for 3, 6, 9, 14 or 28 days compared vs. dimethyl sulfoxide (DMSO) treatment (percentages did not significantly change between time points following DMSO treatment, which is shown at day 3 only for clarity) [n = 3 independent experiments; mean ± 95% confidence interval (CI), two‐way anova with Tukey's post‐hoc correction for comparison of dead cells (## P = 0·007, **P = 0·001, ****P < 0·001)]. (b) Representative flow cytometry plots of A375 cells stained with AnnexinV–PE/PI/anti‐CD271 following treatment for 9 days with 16 nmol L−1 trametinib (mean ± SD of three independent experiments). An oval gate over ‘live cells’ was used to quantify CD271 expression, shown in the right‐hand panel. (c) Representative Western blot analysis for CD271 (75 KDa), phospho‐extracellular signal‐regulated kinase [ERK (pERK); 42/44 KDa], total‐ERK (42/44 KDa), p62 (65 KDa), LC3B (LC3‐I upper band, 14 KDa; LC3‐II lower band, 16 KDa), cleaved poly (ADP‐ribose) polymerase (Cle. PARP; 85 KDa) and glyceraldehyde 3‐phosphate dehydrogenase (GAPDH; 37 KDa) expression by A375 cells following treatment with DMSO or 16 nmol L−1 trametinib for 3, 6 or 9 days. (d) Representative fluorescent photomicrographs of LC3–red fluorescent protein (RFP)–green fluorescent protein (GFP) expressing WM266‐4 melanoma cells stained with anti‐CD271 (purple) following treatment for 9 days with DMSO or 16 nmol L−1 trametinib. LC3–RFP–GFP appears in cells as diffuse yellow/green fluorescence in the absence of autophagy but marks autolysosomes with red fluorescent puncta during active autophagy (scale bars = 50 μm). (e, f) Relative phospho‐adenosine monophosphate‐activated protein kinase (AMPK) activity or adenosine triphosphate (ATP) release by A375 cells following treatment with 16 nmol L−1 trametinib (Tram) or DMSO for 9 days, or 10 min in the presence of either 1 mmol L−1 H2O2 or 10% sodium dodecyl sulfate (SDS) as positive controls [n = 3 independent experiments; mean ± 95% CI, one‐way anova with Tukey's post‐hoc correction (**P = 0·002, ***P < 0·001)]. (g) Representative Western blot analysis for phospho‐AMPK (pAMPK; 62 KDa), total AMPK (tAMPK; 62 KDa) and GAPDH (37 KDa) expression by A375 cells following treatment with 16 nmol L−1 trametinib for 9 days, alone or in the presence of 5 μmol L−1 Compound C (CC) for the final 24 or 48 h.
