
Figure 3. Subgroup Analysis for the Primary Outcome.
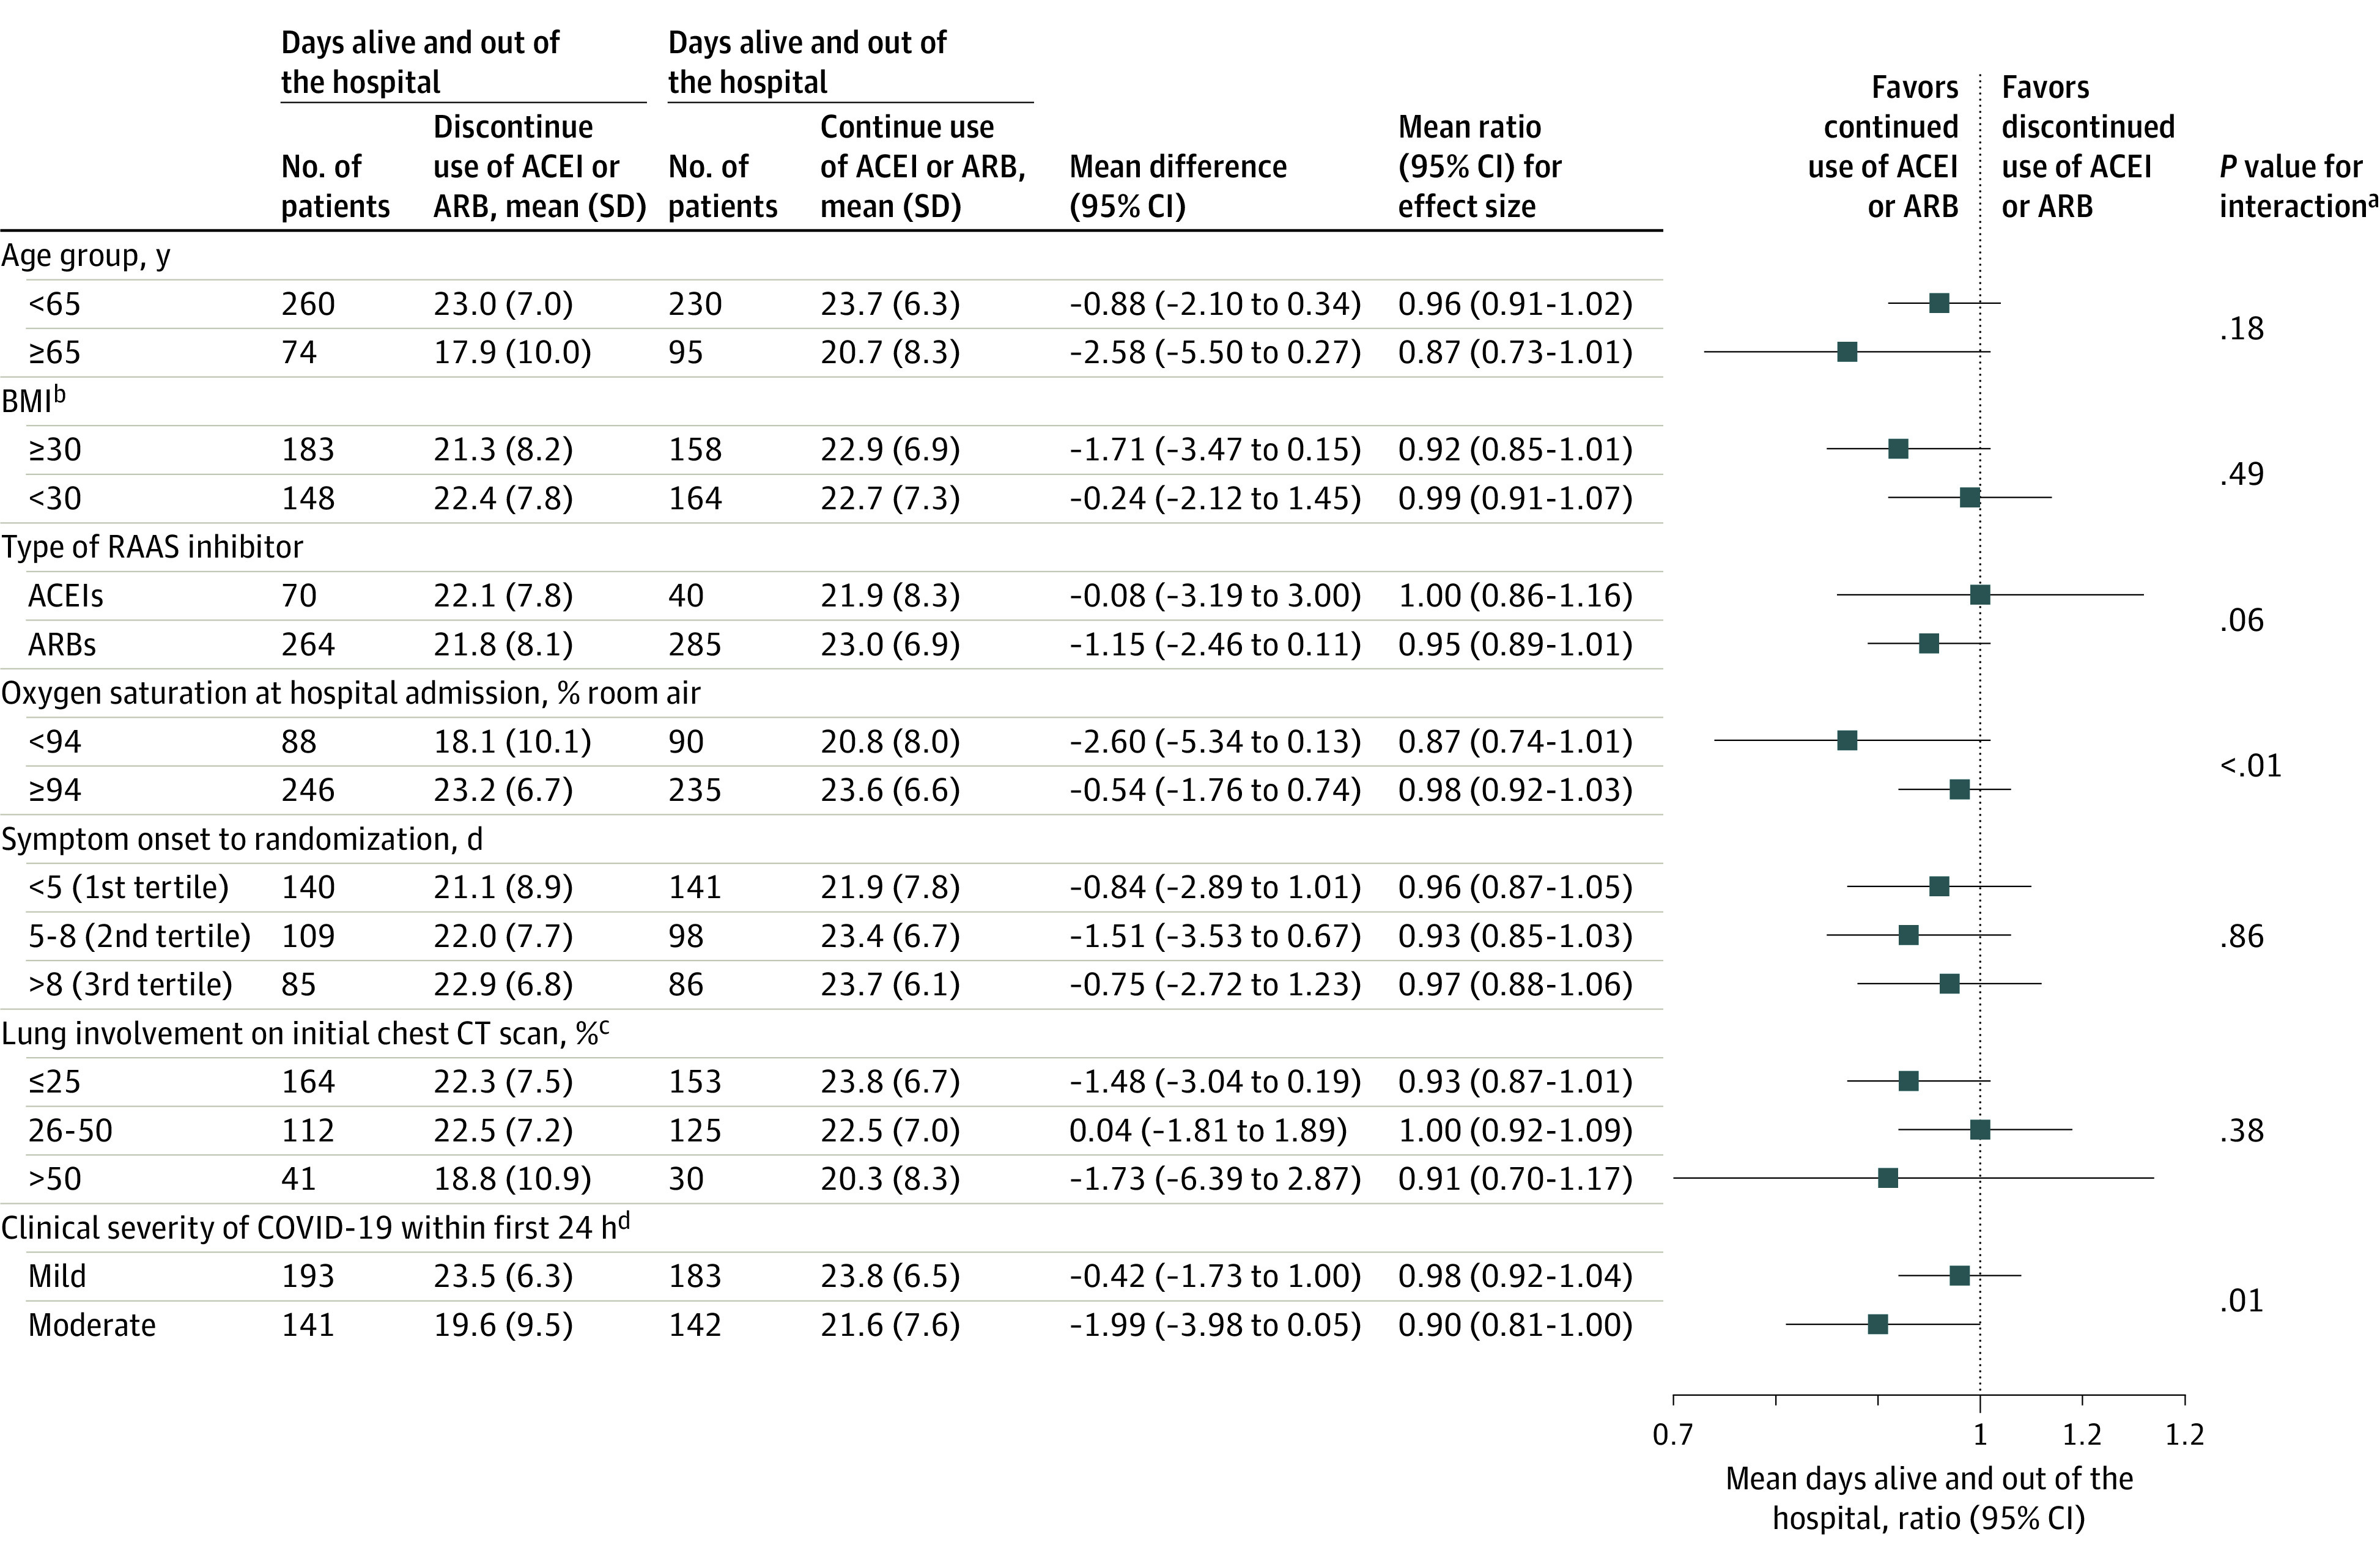
ACEI indicates angiotensin-converting enzyme inhibitor; ARB, angiotensin II receptor blocker; BMI, body mass index; CT, computed tomographic; RAAS, renin-angiotensin-aldosterone system.
aThe subgroup analyses were performed using the same generalized additive model of location, scale, and shape with beta binomial distribution inflated at zero that was used for the primary outcome, including interaction terms between each subgroup and study treatments.
bCalculated as weight in kilograms divided by height in meters squared.
cEstimated by visual assessment performed by a radiologist.
dDefined as change in clinical severity status during hospitalization. Mild defined as blood oxygen saturation of 94% or greater and lung infiltrates less than or equal to 50%; moderate, blood oxygen saturation less than 94%, or lung infiltrates greater than 50%, or ratio of partial pressure of arterial oxygen to fraction of inspired oxygen less than 300; and severe, invasive mechanical ventilation or hemodynamic instability or multiple organ dysfunction or failure.