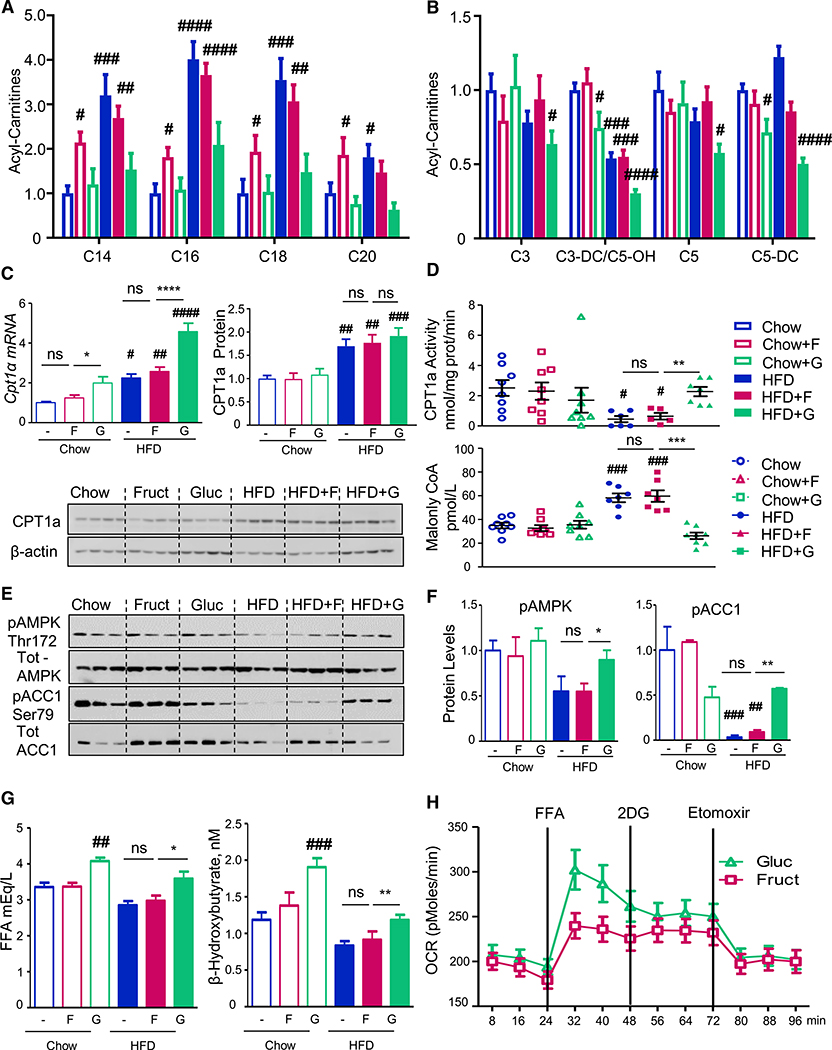
Figure 1. Fructose and Glucose Supplementation Modifies Fatty Acid Oxidation.
(A and B) Long- (A) and short-chain (B) acylcarnitine profiles measured from the livers of mice collected in the fed state after 10 weeks on respective diets. The data are represented as mean ± SEM, n = 6 mice per group. Complete names of acylcarnitines are provided in Table S2.
(C) Cpt1a mRNA expression and protein levels.
(D) CPT1a activity in isolated mitochondria and hepatic malonyl-CoA levels from the same mice. n = 8 mice per group. # denotes the significant difference as compared to the chow control, whereas * signifies the significant difference between the groups under the crossbar.
(E and F) Hepatic pAMPK and pACC1 levels.
(G) Serum FFA and β-hydroxybutyrate levels in overnight fasted mice.
(H) Oxygen consumption rate in AML-12 hepatocytes pretreated with glucose or fructose for 48 h.

