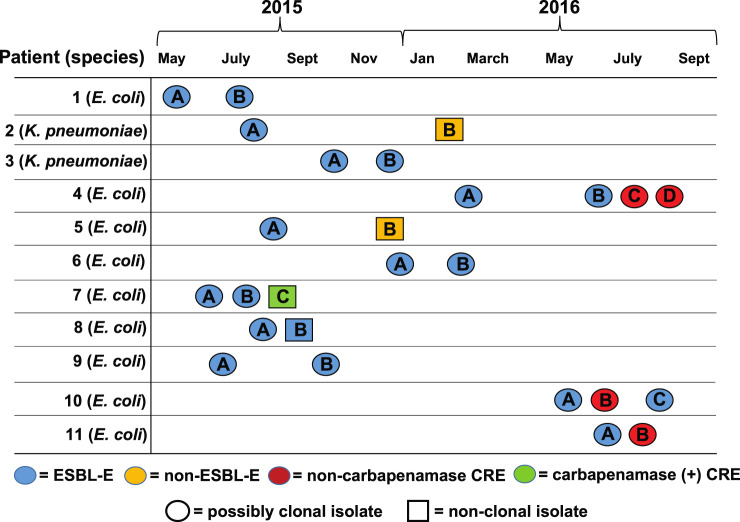
Figure 1.
Timeline showing date of serial strain isolation from blood cultures. Patient numbers and species isolated are in the first column. The shape and colour of the isolate labels indicate potential clonality and AMR, respectively. Isolates were considered possibly clonal if they were the same ST and clustered on the phylogenetic tree presented in Figure S1. Patient subgroups (e.g. Patient 1; isolates A and B) refer to the order of isolation.

