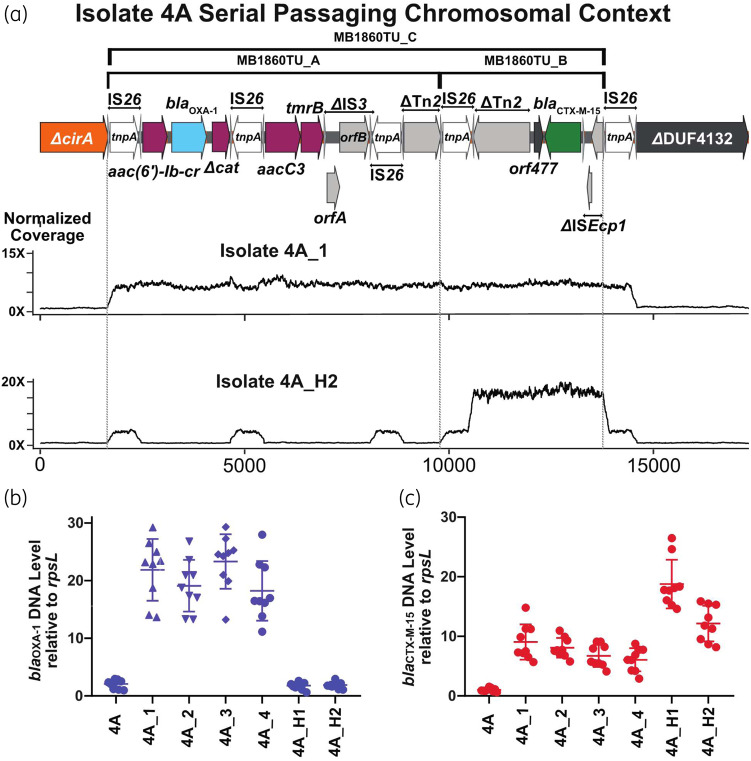
Figure 4.
Identification and characterization of β-lactamase gene amplification following serial passaging of the index isolate 4A under ertapenem exposure. Isolate 4A was grown in the presence of ertapenem with isolates 4A_1 to 4A_4 collected during the first round of passaging and 4A_H1 and 4A_H2 collected during the second round. (a) Schematic of TnMB1860 locus from isolate 4A as detailed in Figure 3. Immediately below the schematic are normalized, short-read coverage depth line graphs for isolates 4A_1 and 4A_H2 aligned to index isolate 4A with the location of MB1860TU_A and MB1860TU_B bracketed by dotted lines. Note amplification of MB1860TU_C (i.e. MB1860TU_A and MB1860TU_C combined) in isolate 4A_1 whereas only MB1860TU_B is amplified in isolate 4A_H2. (b, c) TaqMan qPCR of genomic DNA collected in triplicate on two separate days (n = 6) for either blaOXA-1 (b) or blaCTX-M (c) relative to the endogenous control gene rpsL. Data shown are individual data points with mean ± SD superimposed.

