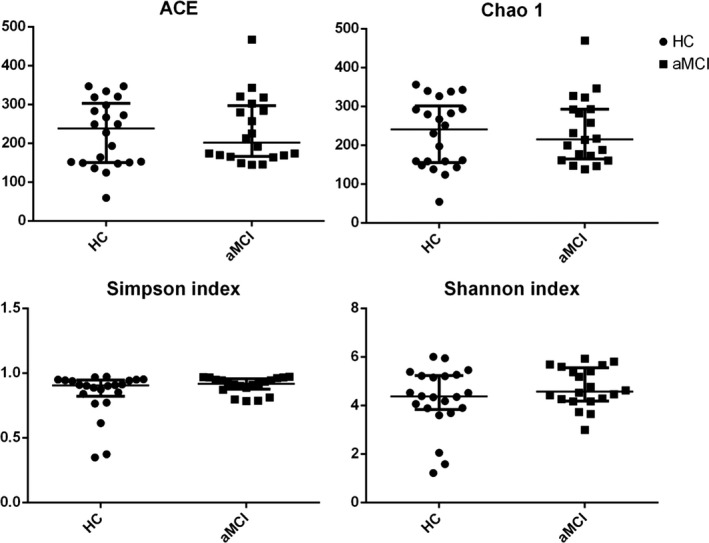
FIGURE 1.

The alpha‐diversity of the GM in aMCI and healthy control subjects depict according to abundance‐based coverage estimator (ACE) and Chao1, Simpson's index, and Shannon's index. Each scatter plot represents the median, interquartile range, minimum, and maximum values. P values were determined using a Mann‐Whitney test. HC, healthy control; aMCI, amnestic mild cognitive impairment
