
FIGURE 2.
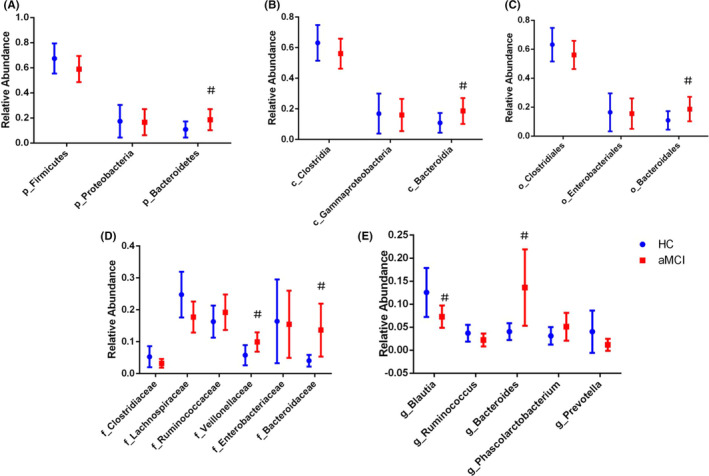
Comparison of the representative taxonomic abundance between aMCI and HC groups (mean value with 95% confidence interval). t Test or Kruskal‐Wallis test indicated the significant differences in Bacteroidetes (A) between the two groups, and also in their corresponding class (B), order (C), family (D), and genus (E) (blue, HC; red, aMCI). Note: # P < .05 compared with HC group. Abbreviations: HC, normal cognition healthy control; aMCI, amnestic mild cognitive impairment; p, phylum; c, class; o, order; f, family; g, genus