
FIGURE 5.
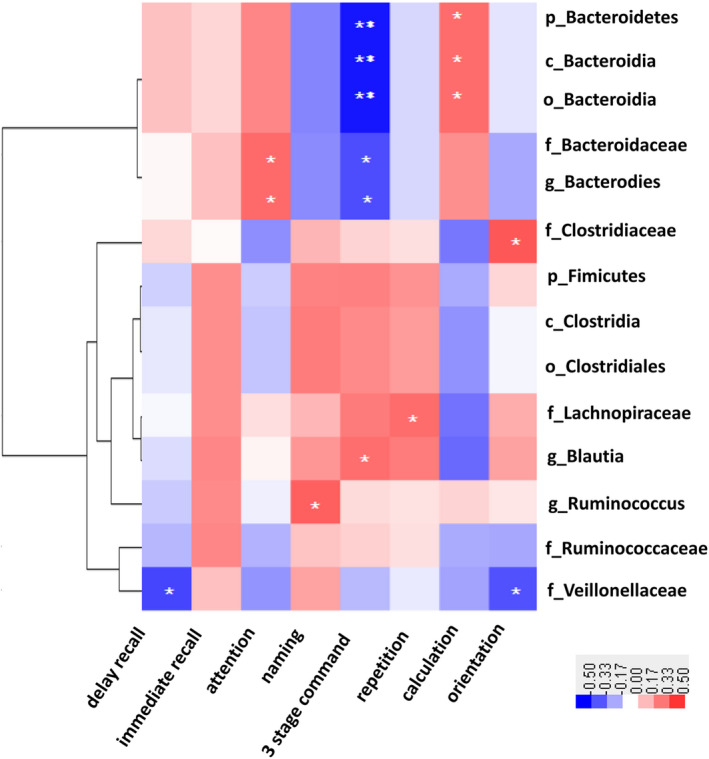
Heatmap showing correlations between fecal microbiome and cognitive test scores of all subjects. Red means positive correlation and blue means negative correlation; *P < .05, **P < .01
Official websites use .gov
A
.gov website belongs to an official
government organization in the United States.
Secure .gov websites use HTTPS
A lock (
) or https:// means you've safely
connected to the .gov website. Share sensitive
information only on official, secure websites.
Heatmap showing correlations between fecal microbiome and cognitive test scores of all subjects. Red means positive correlation and blue means negative correlation; *P < .05, **P < .01