
Figure 6.
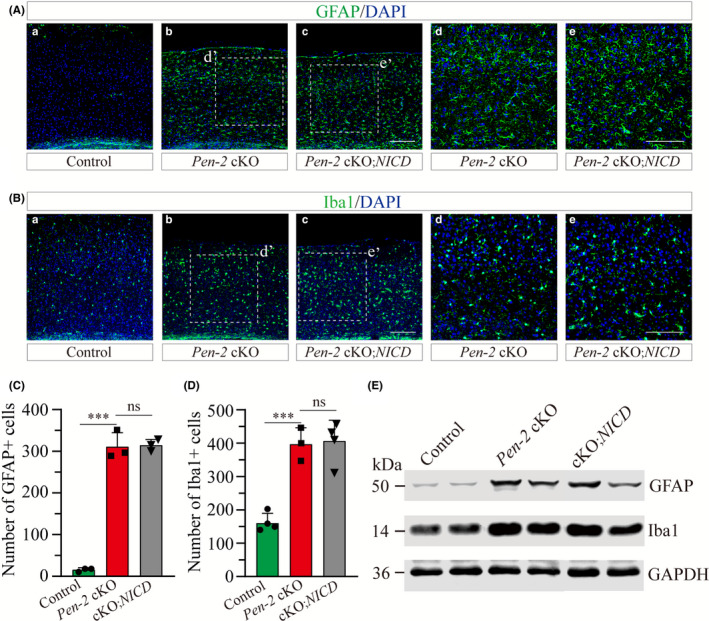
NICD does not reduce gliosis in Pen‐2 cKO mice. A‐B, Representative images for fluorescence IHC on GFAP (A) and Iba1 (B). Images were taken from the cortex of control, Pen‐2 cKO or Pen‐2 cKO;NICD mice. Boxed areas in (b,c) were enlarged as (d,e). Scale bar is 200 μm in (a‐c) or 100 μm in (d‐e). C, Averaged number of GFAP+ cells in the cortex. There was no significant difference between Pen‐2 cKO and Pen‐2 cKO;NICD mice. There was significant difference between Pen‐2 cKO and control mice (ns, not significant; ***P < 0.001; n = 3 mice per group). D, Averaged number of Iba1+ cells in the cortex. There was no significant difference between Pen‐2 cKO and Pen‐2 cKO;NICD mice. There was significant difference between Pen‐2 cKO and control mice (ns, not significant; ***P < 0.001; n = 3‐4 per group). E, Western blotting on GFAP and Iba1. Cortical samples of control, Pen‐2 cKO and Pen‐2 cKO;NICD mice were used. Blots for GFAP or Iba1 were comparable between Pen‐2 cKO and Pen‐2 cKO;NICD mice