FIGURE 5.

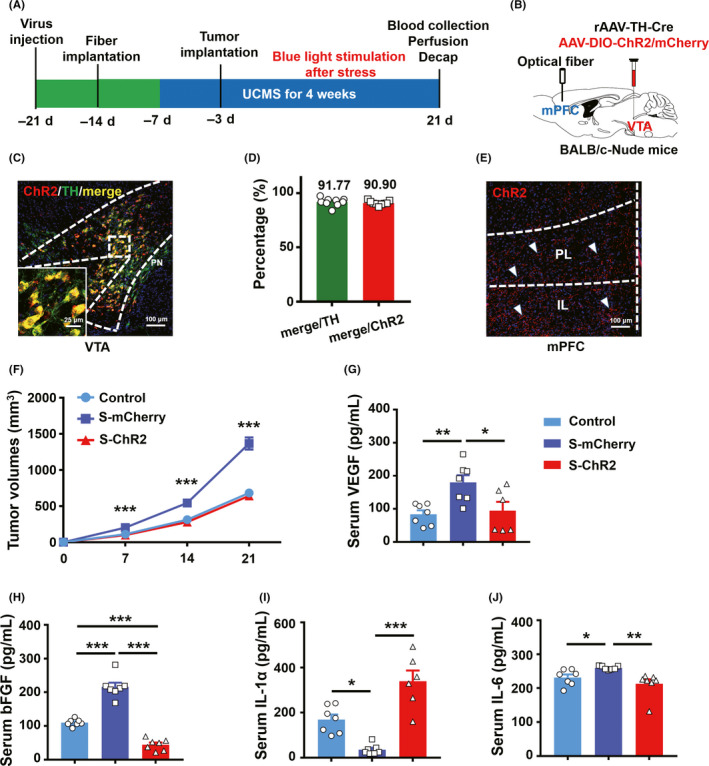
Repeated optogenetic stimulation of VTATH terminals in the mPFC ameliorates tumor progression induced by chronic stress in BALB/c nude mice. (A) ~ (B), Schematic illustration of optogenetic manipulation in BALB/c nude mice bearing 4T1 cancer cells. (C), Coronal image co‐localization of ChR2‐mCherry with TH‐expressing neurons in VTA in BALB/c nude mice. Red: ChR2‐mCherry, green: TH‐positive neurons. Scale bar, 100 μm, insert scale bar 25 μm. (D), Percentage expression of TH and ChR2‐mCherry neurons in BALB/C‐Nu mice; n = 9 slices from 3 mice. (E), Representative example showing the distribution of ChR2‐mCherry‐expressing axons in the mPFC of a BALB/c nude mouse. Red: ChR2‐mCherry. Scale bar, 100 μm. (F), Tumor volume changes in 4T1 tumor‐bearing nude mice with ChR2 or mCherry with UCMS and chronic optogenetic stimulation; n = 9 control, n = 9 S‐mCherry, n = 11 S‐ChR2, ANOVA, Bonferroni post hoc test. (G) ~ (J), Serum concentrations of VEGF, bFGF, IL‐1a, and IL‐6; G, H, I, J n = 7 control, n = 7 S‐mCherry, H, J n = 7 S‐ChR2, G, I n = 6 S‐ChR2, ANOVA, Bonferroni post hoc test. *P < .05, **P < .01, ***P < .001
