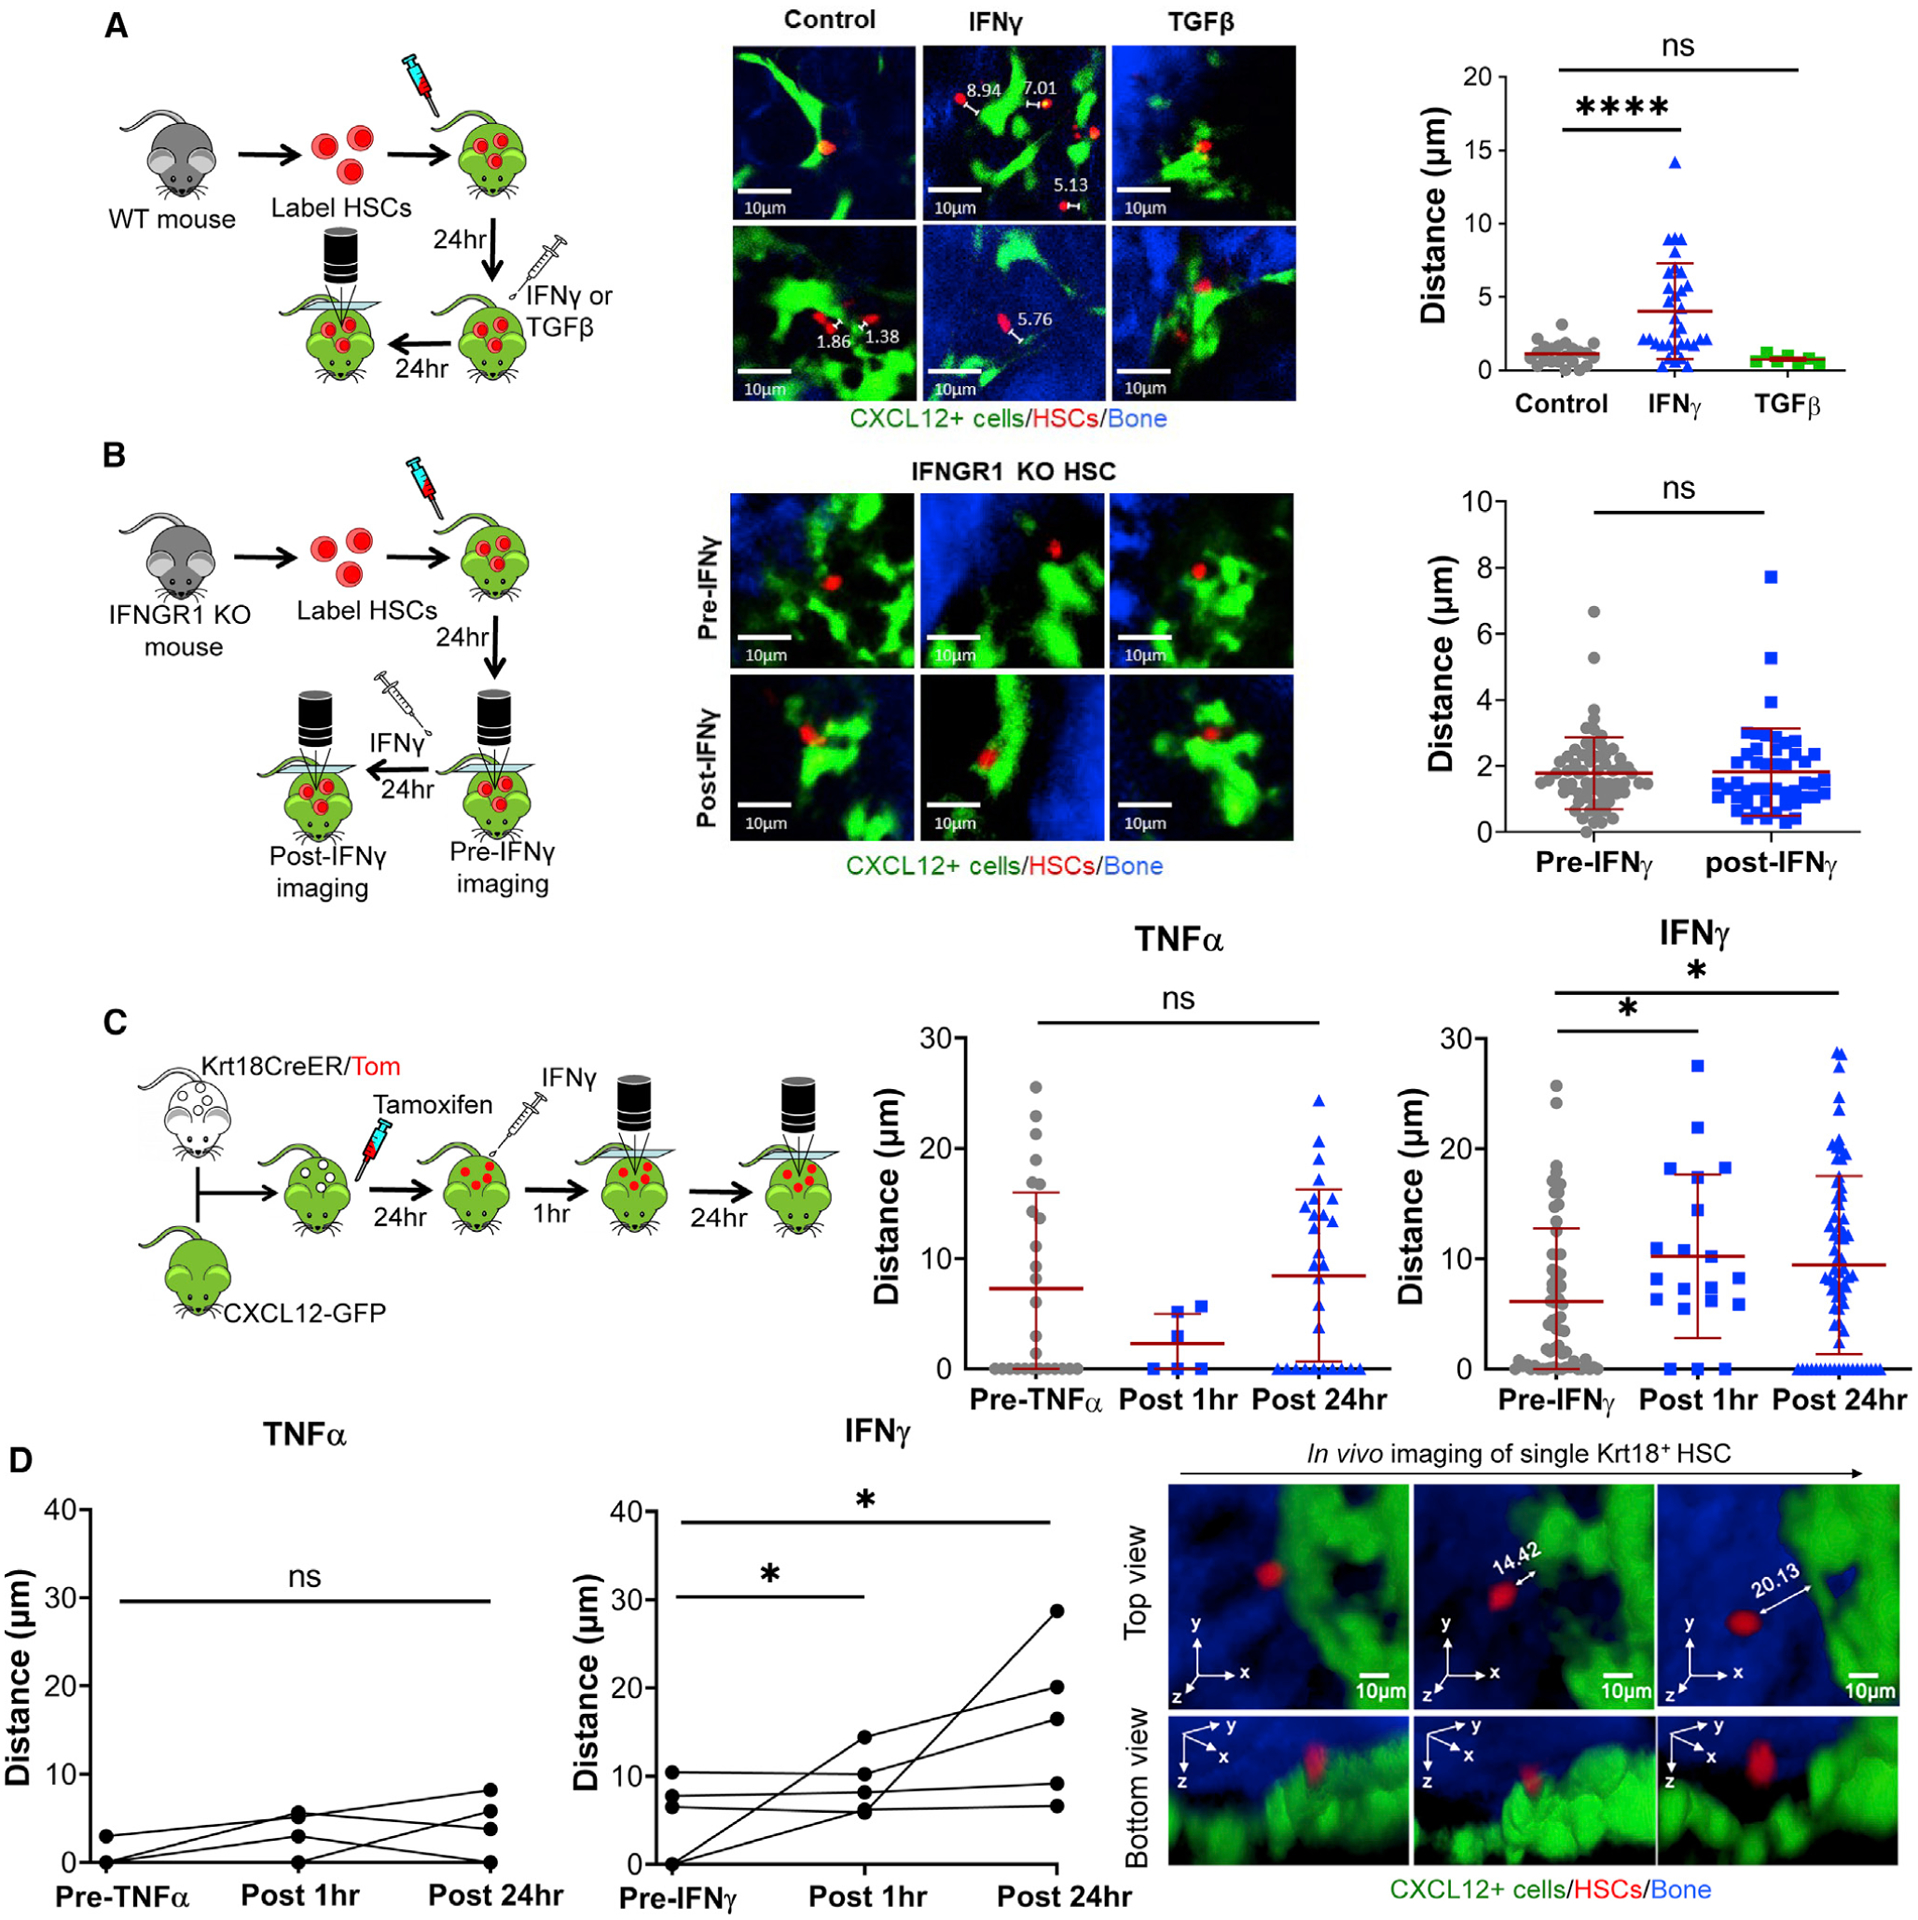
Figure 1. IFNγ Induces HSC Relocalization Away from CAR Cells.

(A and B) Intravital imaging of the calvarium of CXCL12-GFP mice transplanted with CMTMR-stained HSCs. Representative images show HSCs in red (CMTMR), CAR cells in green (GFP), and bone in blue. For quantification, each point represents a single CMTMR-stained HSC.
(A) Recipient CXCL12-GFP mice were treated with IFNγ or TGF-β following transplant, and mice were imaged 24 h after treatment. Distances shown are in μm. Mean distances: control, 1.12 μm, n = 22; TGF-β, 0.74 μm, n = 7; IFNγ, 4.03 μm, n = 33. Data are compiled from 4 independent experiments.
(B) HSCs were isolated from Ifngr1−/− mice. Recipient CXCL12-GFP mice were imaged before (pre-IFNγ) and after treatment with IFNγ (post-IFNγ) following transplant of labeled HSCs. n = 48–66. Mean distances: control, 1.78 μm, n = 48; IFNγ, 1.82 μm, n = 66. Data are representative of 2 independent experiments.
(C) Intravital imaging of the calvarium of Krt18/Tom/CXCL12-GFP mice 24 h after a single dose of tamoxifen (50 mg/kg) and imaging of Krt18+ HSCs after IFNγ or TNF-α treatment. n = 6–71. Mean distances: pre-TNFα, 7.28 μm, n = 26; post-TNFα 1 h, 2.30 μm, n = 6; post-TNF-α 24 h, 8.45 μm, n = 27; pre-IFNγ, 6.16 μm, n = 64; post-IFNγ 1 h, 10.24 μm, n = 20; post-IFNγ 24 h, 9.30 μm, n = 71. Data are representative of 2 independent experiments.
(D) Change in distance of the same Krt18+ HSCs at the indicated time after TNF-α or IFNγ treatment. Representative 3-dimensional images of a single Krt18+ HSC tracking at 24 h after tamoxifen (pre) or 1 h and 24 h after IFNγ treatment. Scale bars are 10μm; A–C error bars are presented as mean ± SD;*p < 0.05, ****p <0.0001; ns, not significant by Mann-Whitney test or Kruskal-Wallis test.
