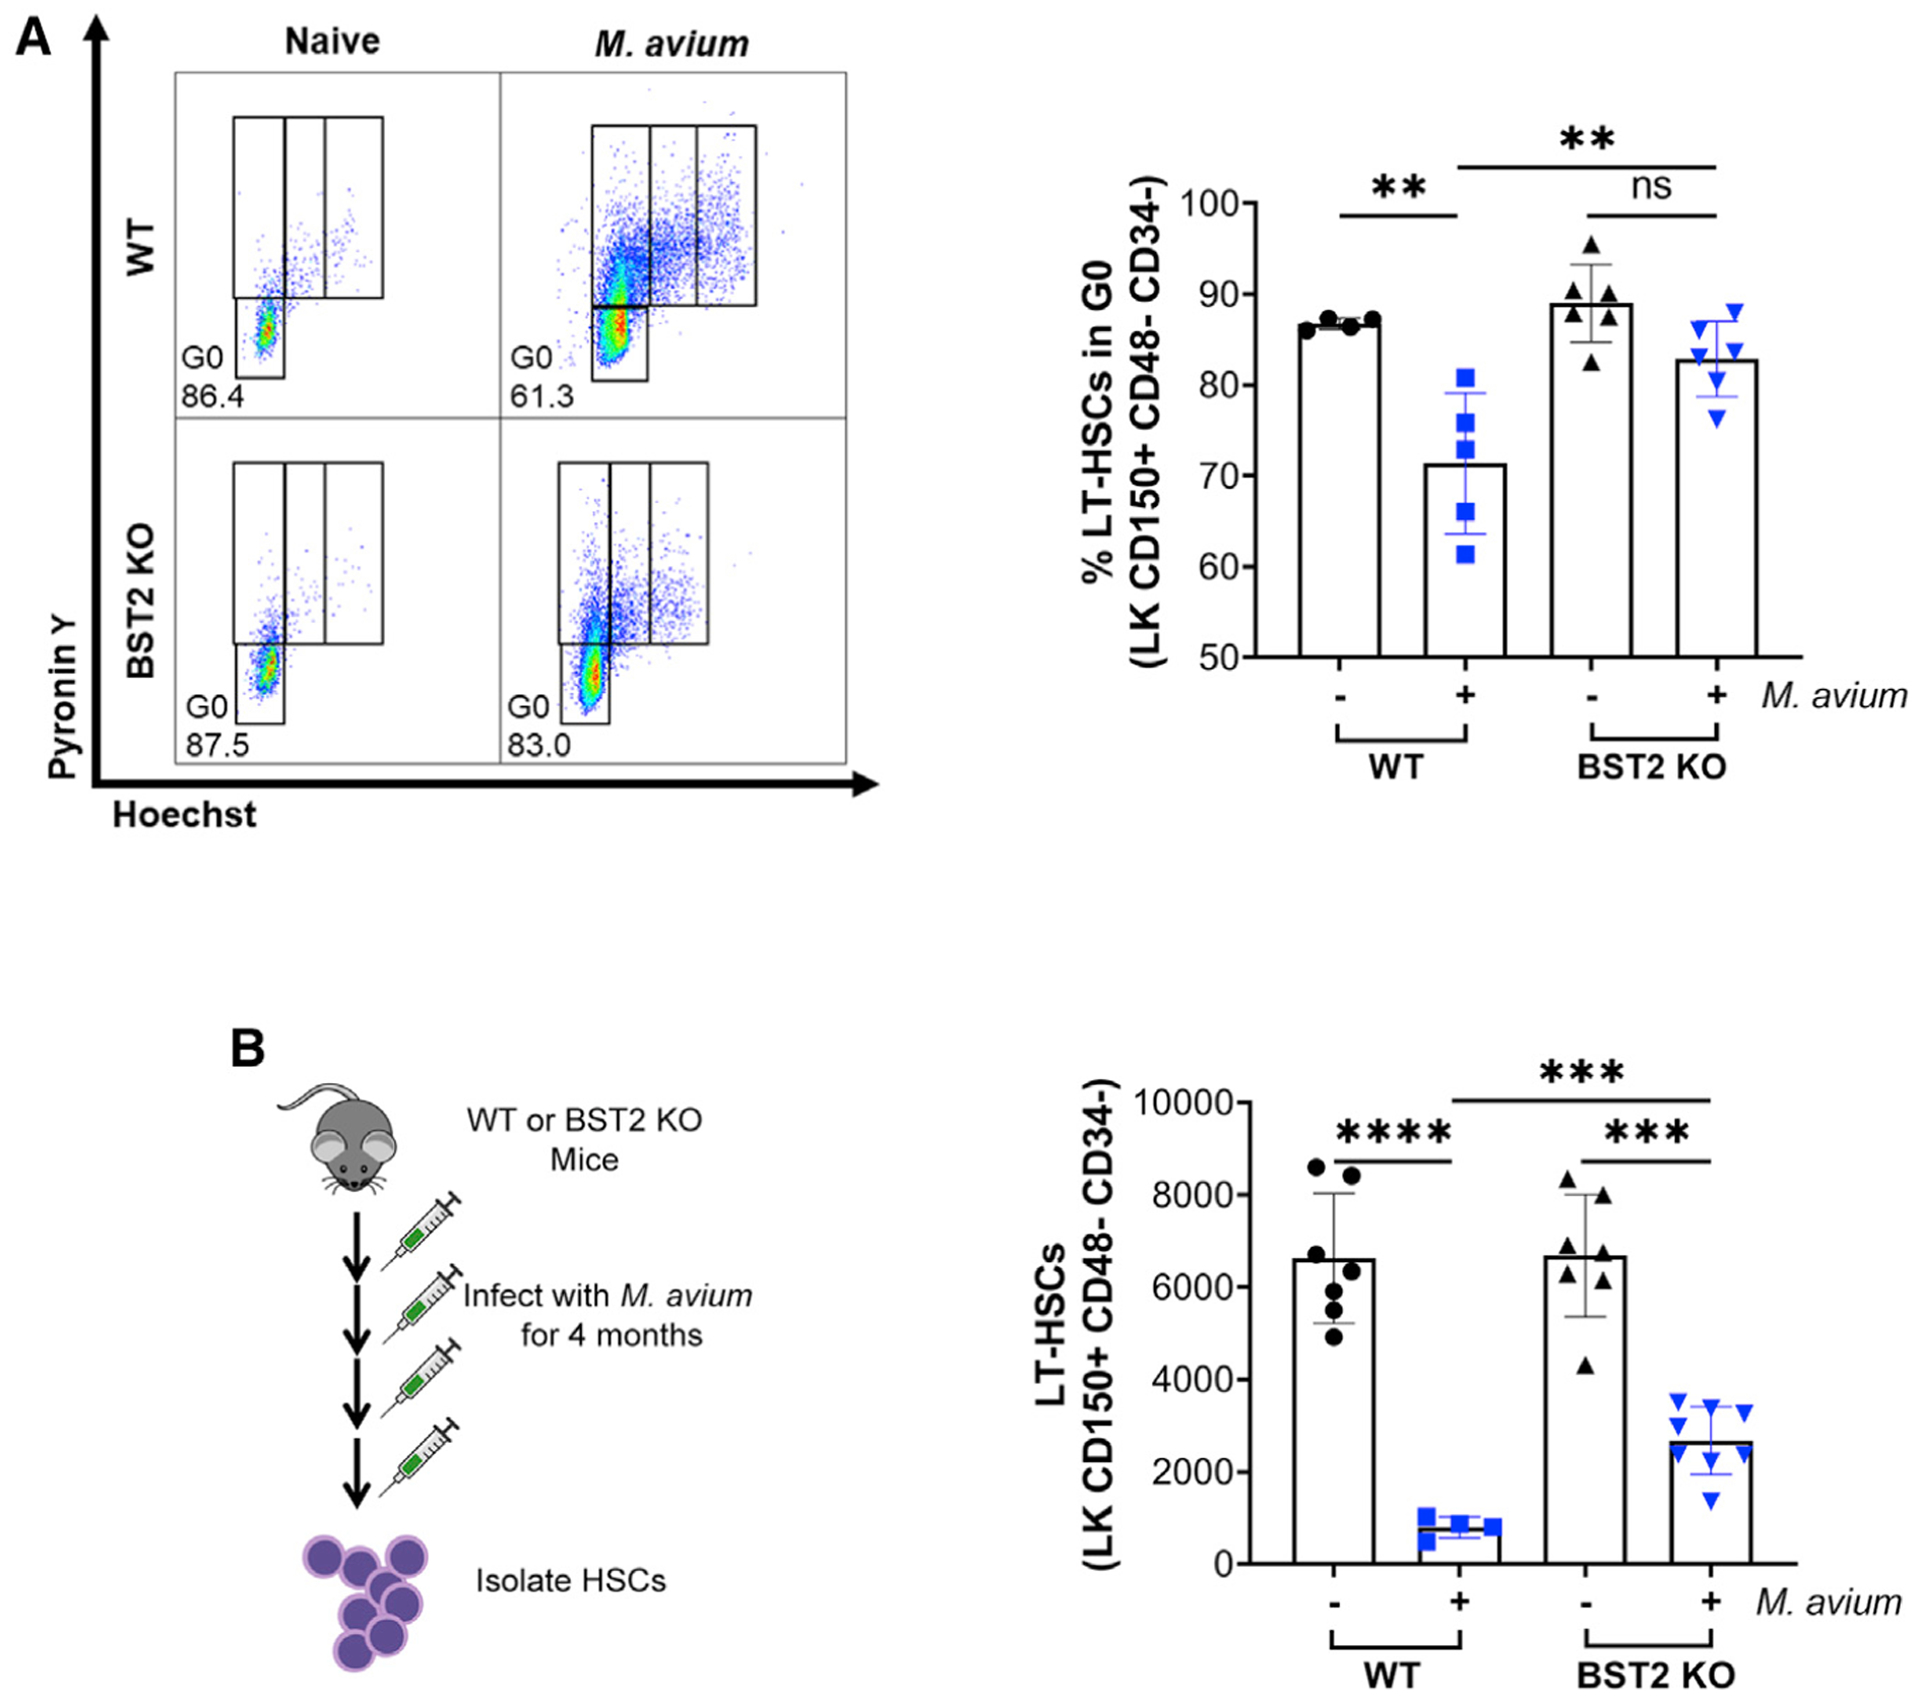
Figure 5. BST2 Regulates HSC Quiescence and Maintenance.

(A) Representative flow plots of cell cycle analysis of HSCs using Hoechst pyronin Y. Bottom left gating indicates G0. Hoechst pyronin Y staining of HSCs isolated from WT or Bst2−/− naive or M. avium-infected mice. Shown as % of total HSCs (LK CD150+ CD48− CD34−) in G0.
(B) LT-HSCs (LK CD150+ CD48− CD34−) per bone after 4 months of M. avium infection. *p <0.05, **p < 0.01, ***p < 0.001, ****p < 0.0001. Error bars represent mean ± SD.
