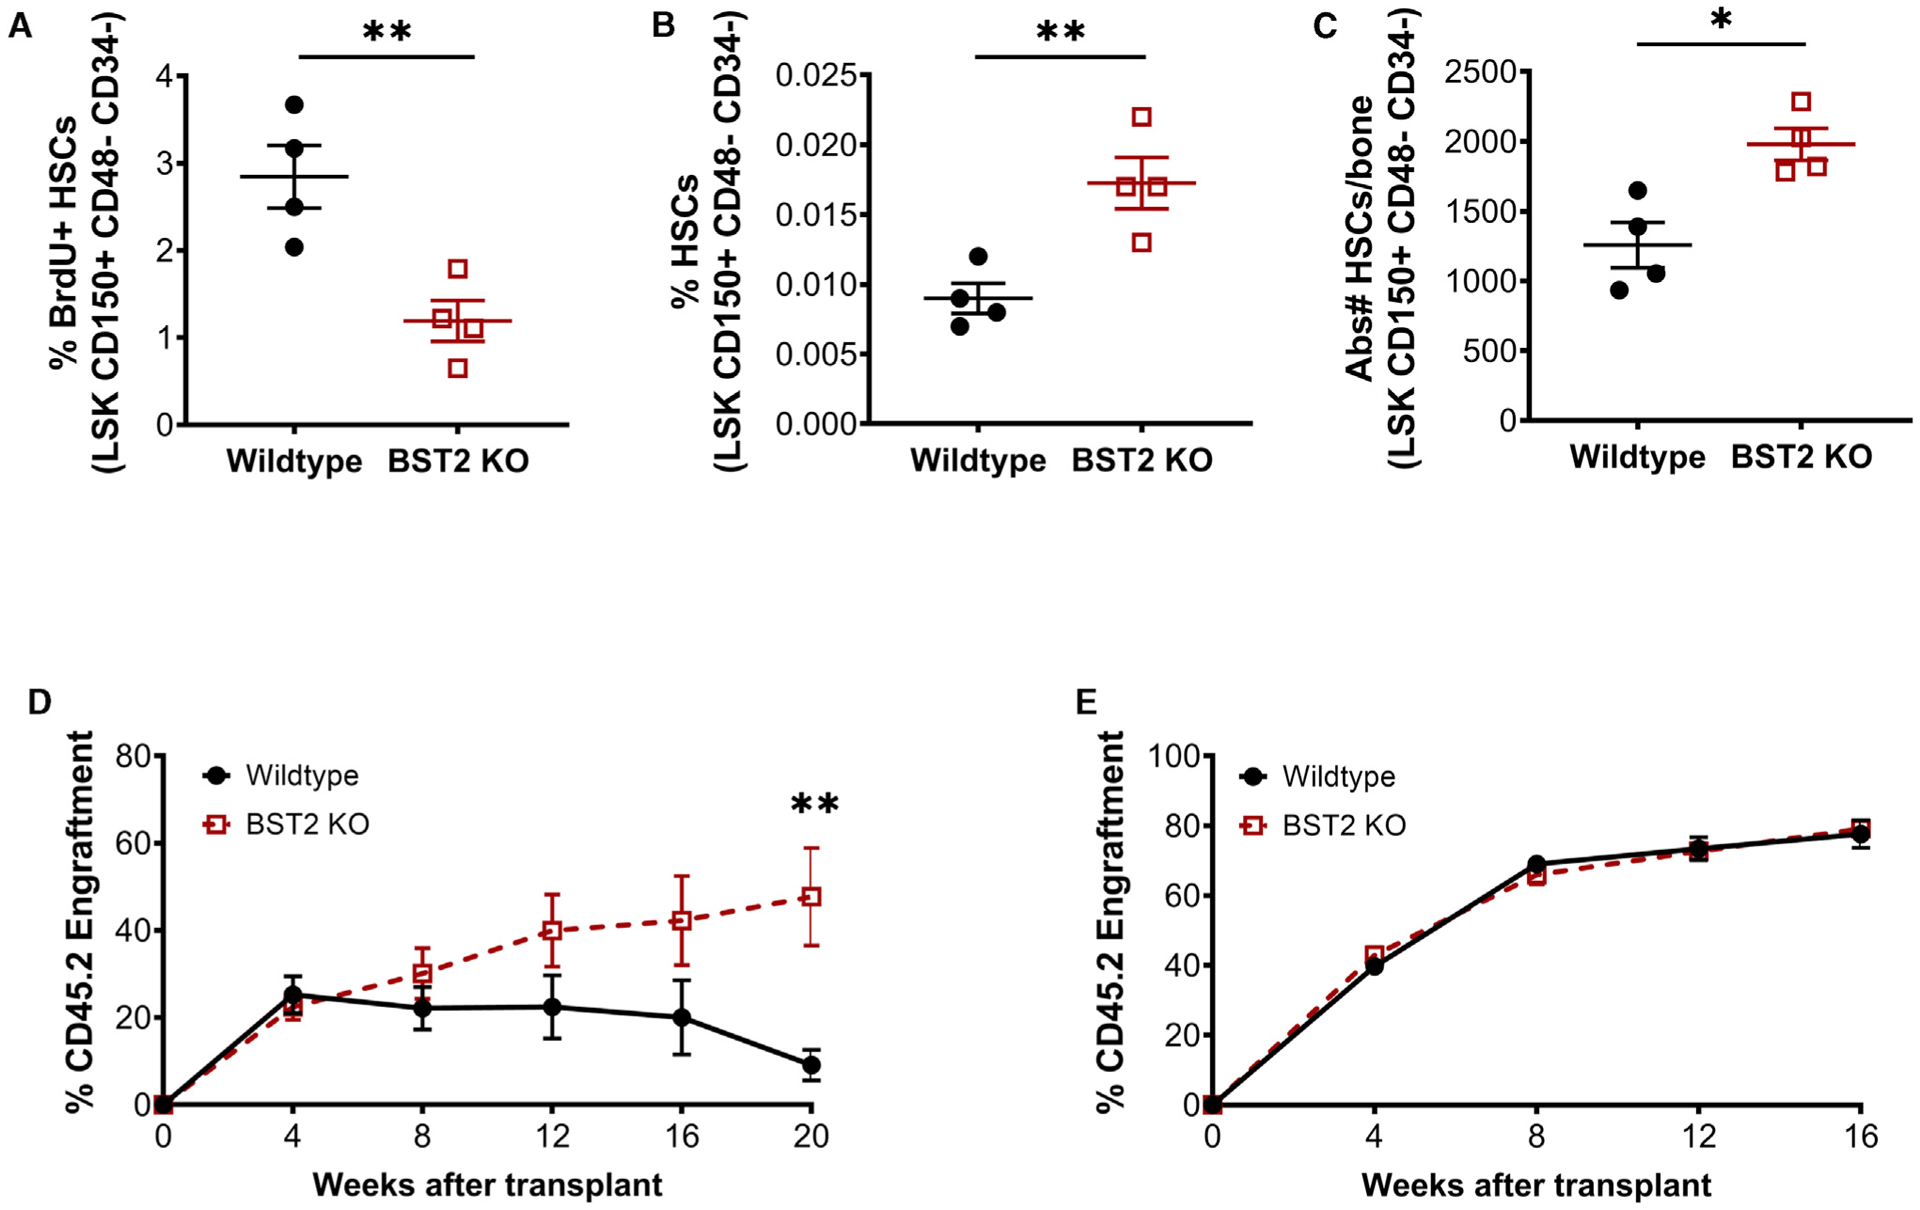
Figure 6. Loss of BST2 Reduces HSC Proliferation and Increases HSC Numbers.

(A) BrdU+ HSCs isolated from WT or Bst2−/− mice. Shown as % of total HSCs (LSK CD150+ CD48− CD34−). n = 4; data are representative of 2 independent experiments.
(B and C) The number of HSCs in WT or Bst2−/− mice.
(B) The % of live WBM cells.
(C) Absolute number per bone. n = 4; Data are representative of 4 independent experiments.
(D) Total peripheral blood engraftment following transplant of 2 × 10⁵ CD45.2 WT or Bst2−/− WBM cells mixed with 2 × 10⁵ rescue marrow (CD45.1). n = 10.
(E) Total peripheral blood engraftment following transplant of 300 CD45.2 WT or Bst2−/− HSCs mixed with 2 × 10⁵ rescue marrow (CD45.1). n = 10. Data are presented as mean ± SEM; *p < 0.05, **p < 0.01.
