
Fig. 7.
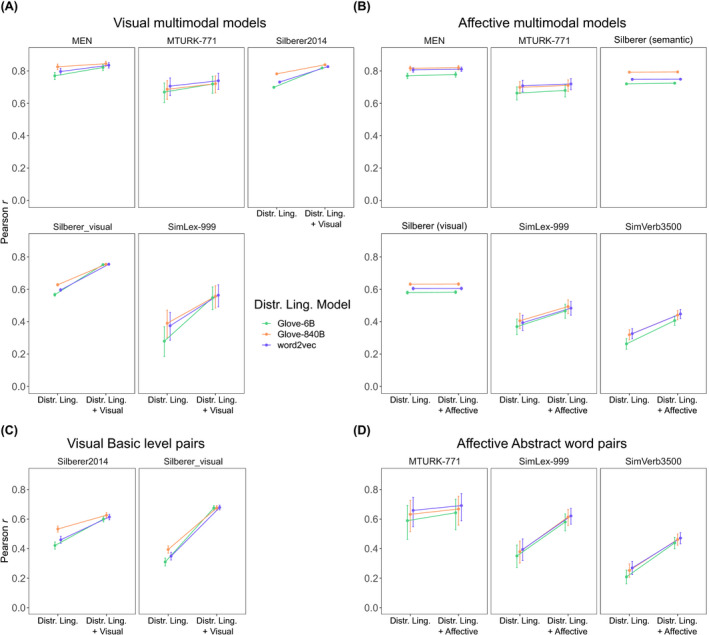
A comparison of the unimodal and multimodal model performance in three different distributional linguistic models: word2vec and GloVe‐6B (6 billion words) and GloVe‐840B (840 billion words). Multimodal models reflect the optimized Pearson correlation for mixing parameters β. Top panels show Pearson correlations and 95% confidence intervals for the visual multimodal models (Panel A) and affective multimodal models (Panel B). The bottom panels show the findings when considering a subset of concrete word pairs at the basic level (Panel C) and abstract affective words (Panel D).