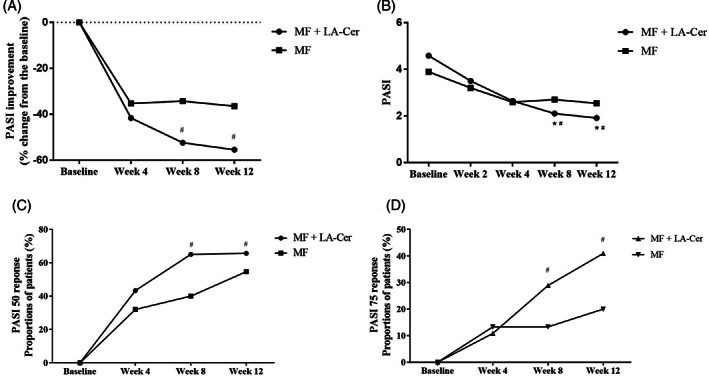
FIGURE 2.

Comparison of PASI improvement between patients treated with or without LA‐Cer moisturizer Graph A, and B, represent PASI improvement and PASI score. Observed clinical response rate was shown as the percentage of patients achieving PASI 50, C, and PASI 75, D, in FAS (Full analysis set). Results are expressed as mean ± SD. n = 75 for MF group, n = 83 for LA‐Cer‐MF group. *Represent the significance differences (P < .05) compared with Week 4; #Represent the significance differences (P < .05) between two groups
