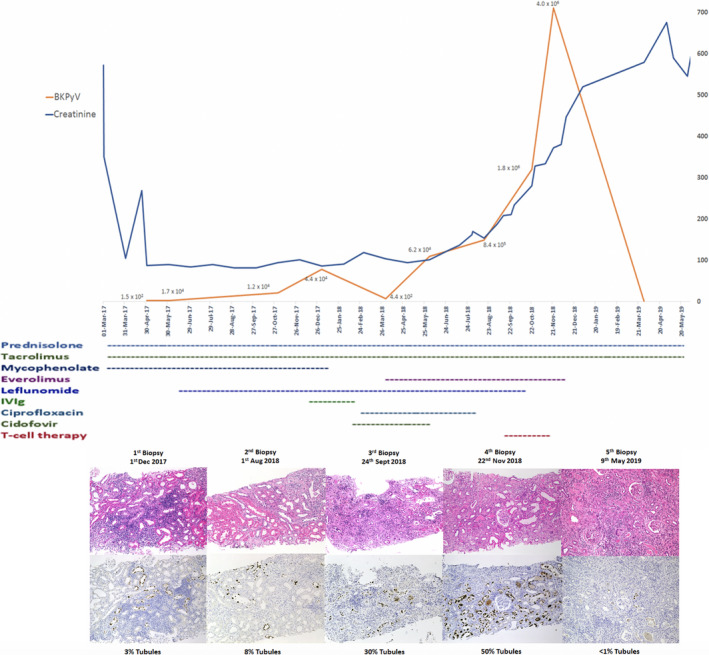
Figure 2.

Longitudinal analysis of creatinine levels, BKPyV counts, therapeutic interventions and histology showing proportion of affected tubules

Longitudinal analysis of creatinine levels, BKPyV counts, therapeutic interventions and histology showing proportion of affected tubules