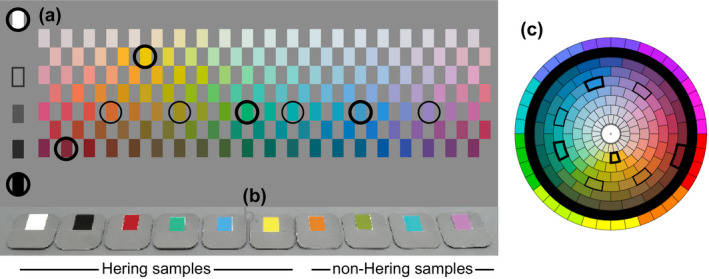
Fig. 2.

Stimuli used in the color decomposition task. (a) One hundred and forty‐five Munsell test color samples, shown in their traditional locations within the World Color Survey stimulus diagram. Black circles: 10 colors comprising elicitation color set; bold circles are the Hering samples. (b) Photograph of the elicitation sample set, arranged according to Hering and non‐Hering color samples. (c) Chromatic stimuli from “a,” shown in radial diagram format. Munsell hue (2.5R through 10RP) varies progressively counterclockwise from the rightward direction; the outer colored ring codes the Munsell hue groups. Munsell value varies from 9.5/(white; center of each panel) to 3/(darkest samples tested; outer ring). Black borders: elicitation samples; bold borders, the Hering samples.
