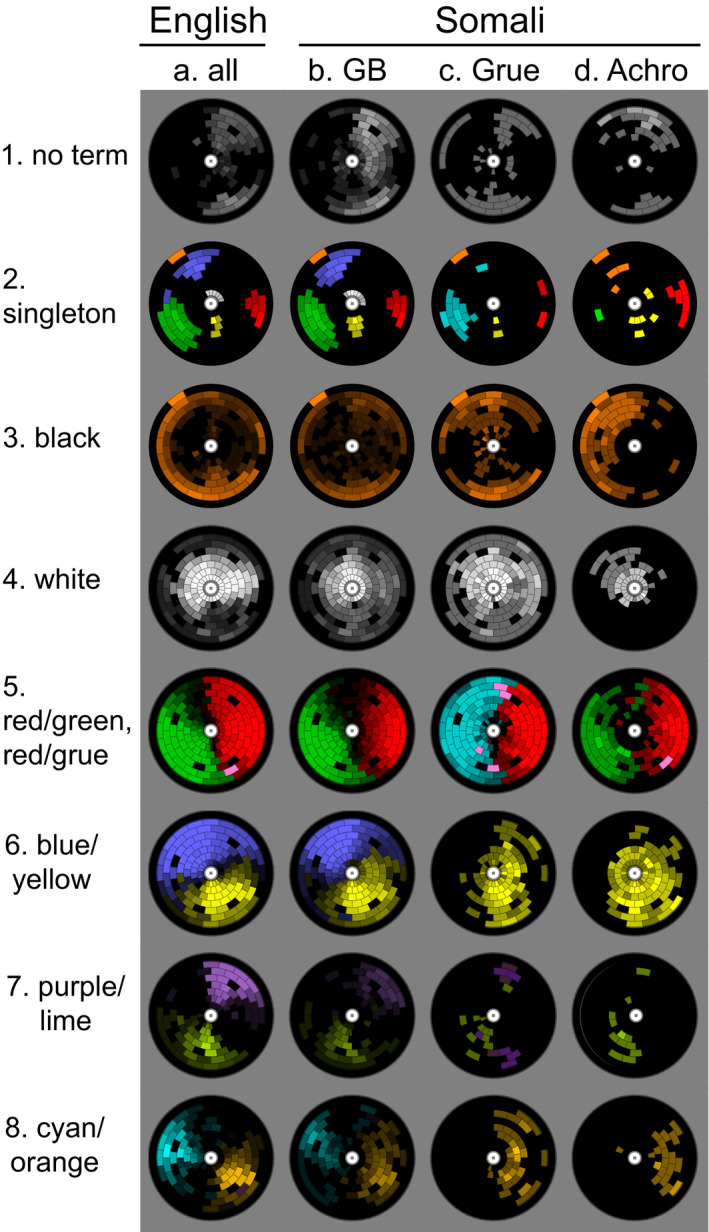
Fig. 4.

Consensus in Hering color term usage. Radial plots of color decomposition responses to 135 chromatic color samples (approximate colors shown in Fig. 2c) and black and white elicitation samples. False colors code the type of term, and false color luminance codes the fraction of informants using the term on an approximately perceptually linearized relative brightness scale ([term used by # observers]/[total # observers])0.65. Black areas: term type not used. Columns a–d, language/motif. Rows 1–8, patterns of color decomposition. “1. no term:” samples not named, false‐colored white. “2. singleton:” usage of single term (red, green, blue, yellow, black, or white) only. “3. black:” black used alone or in combination with other Hering terms, false‐colored orange. Consensus in naming the black elicitation sample is shown as the orange sector on the outermost ring of the radial plots in rows 2 and 3. “4. white”: white used alone or in combination with other Hering terms, false‐colored white. The white elicitation sample is shown as the white disk in the center of each diagram. “5. red/green, red/grue,” “6. blue/yellow:” Hering terms alone or in combination with other terms. “7. purple/lime,” binary combinations of red‐plus‐blue or red‐plus‐grue compared with yellow‐plus‐green or yellow‐plus‐grue. “8. cyan/orange,” binary combinations of green‐plus‐blue compared with red‐plus‐yellow (false‐colored yellowish‐orange). Pink: areas of overlap across observers, where different observers chose different terms, and at least 33% of observers chose the minority term. In panel d2 only, the terms for blue were madow for two observers and dameeri for the third; these have been pooled and coded orange.
