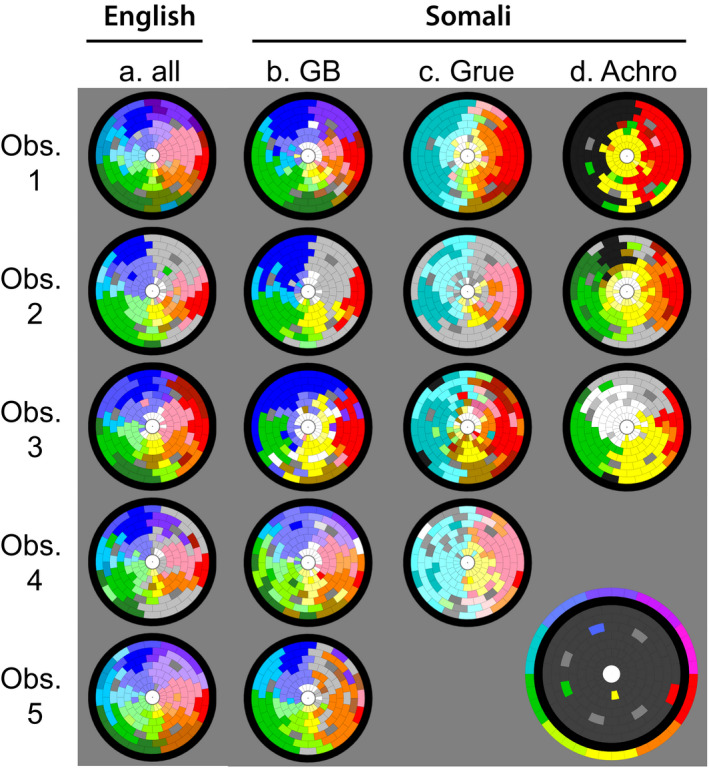
Fig. 5.

Examples of individual color decomposition results applied to chromatic colored samples. False colors indicate the color terms used (Detailed false color keys in Supplemental Materials Figs. S1.3 and S1.4). Lower right: key shows Munsell hue group false‐color‐coded around the rim and elicitation samples in the interior of the plot (false colors: the positions of the Hering elicitation samples; gray, the positions of the non‐Hering elicitation samples). Columns a–d, language/motif groups. Rows 1–5, individual observers within each group. Responses to the red, green, blue, and yellow elicitation samples were added into the rest of the data set. Saturated red, green, blue, and yellow false colors: unitary Hering color terms; other saturated hues: binary combinations of these terms; light colors: corresponding hue term plus white; dark colors: corresponding hue term plus black. Light gray: no term. Middle gray: black‐plus‐white. Dark gray: non‐Hering elicitation samples.
