Fig. 4.

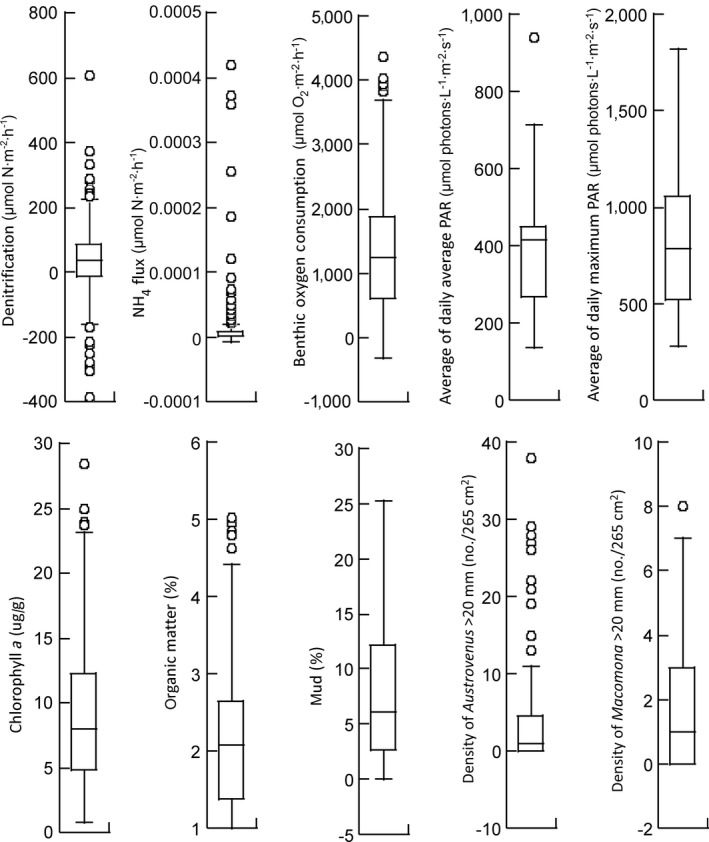
Box plots showing the median (mid line), interquartile range (box edges), and range (whiskers) for sediment, shellfish, and ecosystem function variables used in the structural equation model (SEM).

Box plots showing the median (mid line), interquartile range (box edges), and range (whiskers) for sediment, shellfish, and ecosystem function variables used in the structural equation model (SEM).