
Figure 3.
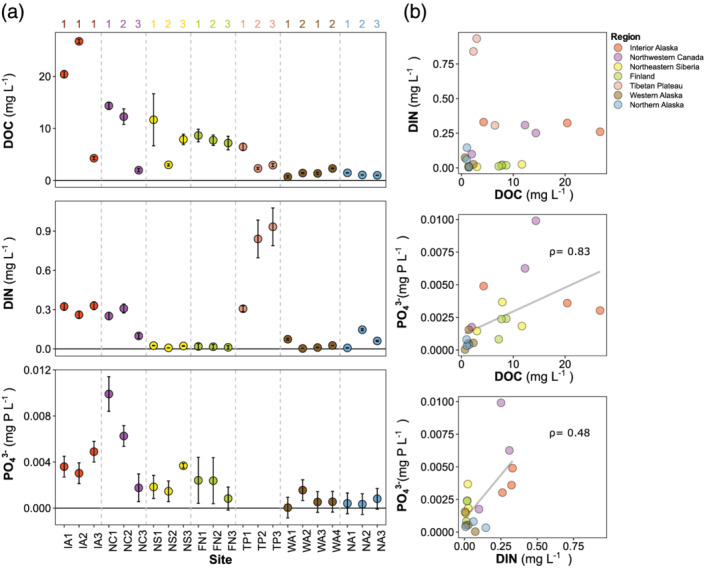
Background nutrient concentrations by site and region. (a) The mean (± standard deviation of three replicates) of dissolved organic carbon (DOC), dissolved inorganic nitrogen (DIN), and phosphate (PO4 3−) in streams from the seven study regions. Regions are separated by the vertical dashed lines and are ordered from highest to lowest mean DOC (left to right). Within regions, sites are ordered by increasing watershed size (longitudinal stream position indicated by the numbering system above the panels) within nested networks, except for IA, where the sites were independent, and WA, where there are two networks. (b) Biplots of mean background nutrient concentrations with Spearman correlation coefficients (ρ) shown when significant (p < 0.05). Phosphate was not determined for TP sites because of sample loss during shipping.