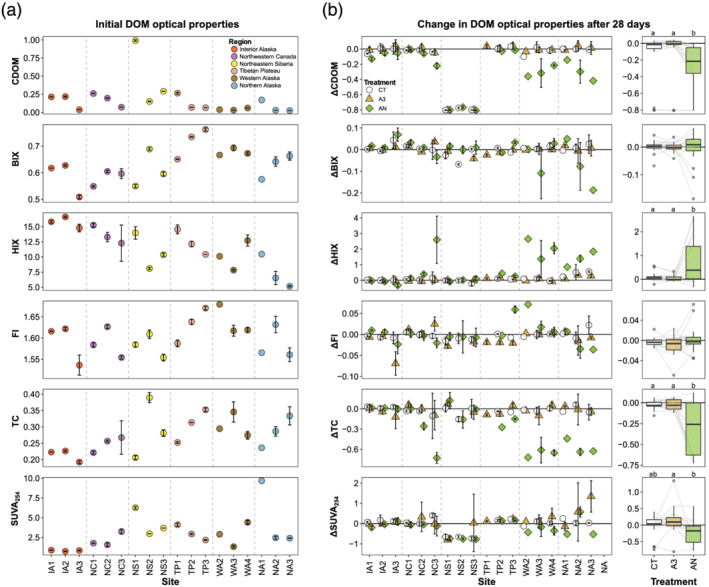
Figure 4.

Initial optical properties of dissolved organic matter (DOM) and change through time during the incubations. (a) Initial colored DOM (CDOM), biological index (BIX), humification index (HIX), fluorescence index (FI), peak T to peak C index (TC), and specific UV absorbance at 254 nm (SUVA254). (b) Proportional change during the incubation for the three treatments where optical proxies were measured: control (CT), high acetate (A3), and acetate plus nutrients (AN). colored dissolved organic matter (CDOM), biological (mean n = 3). for the three treatments where optical measurements were made. In panels (a) and (b), symbology follows Figure 3. Boxplots show the quartiles, median, minimum, and maximum within 1.5 times the interquartile range (IQR) and outliers beyond 1.5 times the IQR. The faint lines behind the boxplots link sites to aid interpretation.
