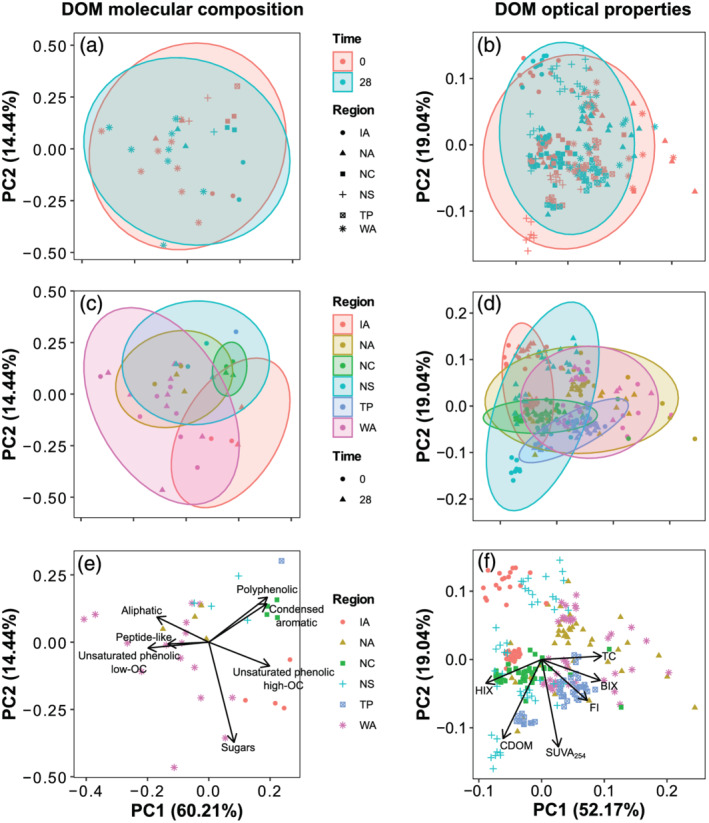
Figure 6.

Principal component analysis of the molecular composition and optical properties of DOM. The percentage of variance explained by the first and second principal components (PC1 and PC2) is shown in parentheses next to the axis titles. Parametric probability ellipses are drawn for the indicated groups (i.e., time of sampling in panels a and b and regional provenance of the sample in panels c and d). Loadings for each parameter are shown in panels (e) and (f). PC3 explained 11% of the variation (Figure S2).
