
Figure 7.
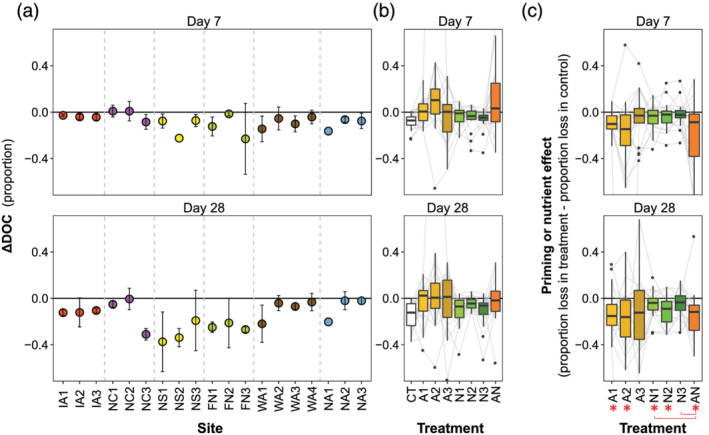
Change in DOC concentration (ΔDOC) after 7 and 28 days and effects of nutrient and acetate addition. (a) Proportional ΔDOC in unamended control treatments by site. (b) Distribution of ΔDOC by treatment. (c) The priming or nutrient effect by treatment expressed as the difference between ΔDOC in the amended treatment and ΔDOC in the unamended control. A positive value represents more DOC loss in the amended treatment (i.e., positive priming or nutrient effect), while a negative value indicates less DOC loss. Asterisks below the x axis indicate statistical difference from 0 based on two‐sided t tests (Bonferroni‐adjusted p < 0.05), and brackets show statistically significant contrasts among treatments based on Tukey‐HSD comparisons following ANOVA (Bonferroni‐adjusted p < 0.05). Symbology follows Figure 4.