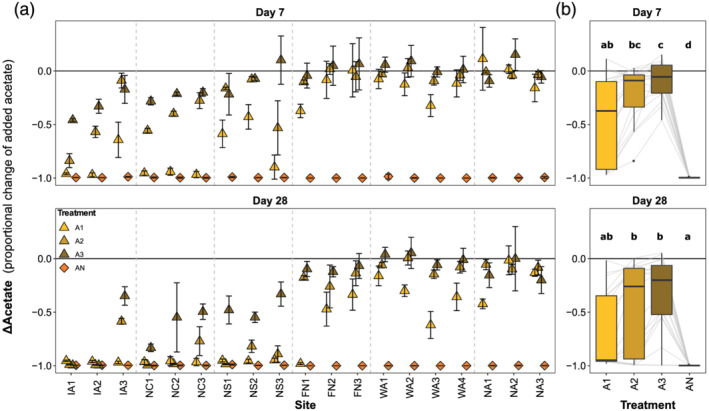
Figure 9.

Change in added acetate after 7 and 28 days. (a) Proportional change in added acetate (ΔAcetate) by site. (b) Distribution of ΔAcetate by treatment. Differences in the letters show statistically significant contrasts among treatments based on Tukey‐HSD comparisons following ANOVA (Bonferroni‐adjusted p < 0.05). Symbology follows Figure 4.
