Figure 10.

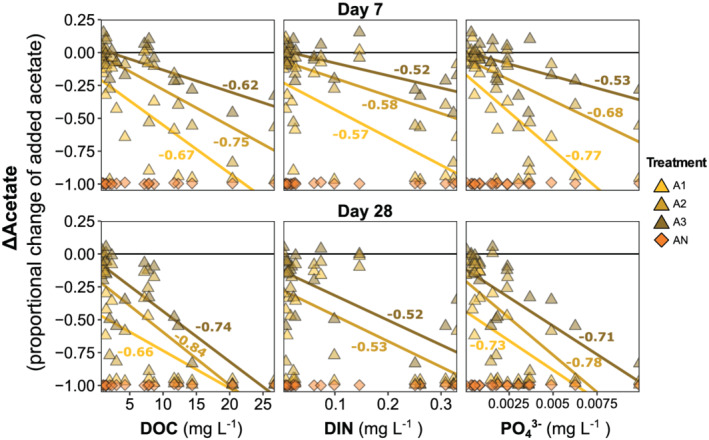
Relationships between change in added acetate and background nutrients. Spearman correlation coefficients (ρ) for each treatment shown when significant (p < 0.05). Symbology follows Figure 8.

Relationships between change in added acetate and background nutrients. Spearman correlation coefficients (ρ) for each treatment shown when significant (p < 0.05). Symbology follows Figure 8.