
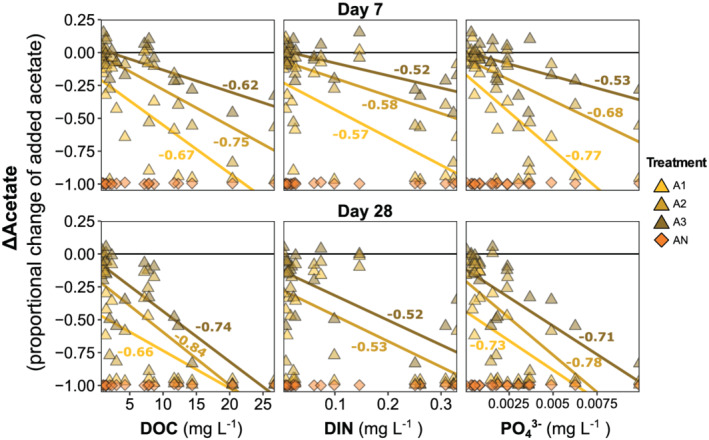
Figure 10.
Relationships between change in added acetate and background nutrients. Spearman correlation coefficients (ρ) for each treatment shown when significant (p < 0.05). Symbology follows Figure 8.
Official websites use .gov
A
.gov website belongs to an official
government organization in the United States.
Secure .gov websites use HTTPS
A lock (
) or https:// means you've safely
connected to the .gov website. Share sensitive
information only on official, secure websites.
Relationships between change in added acetate and background nutrients. Spearman correlation coefficients (ρ) for each treatment shown when significant (p < 0.05). Symbology follows Figure 8.