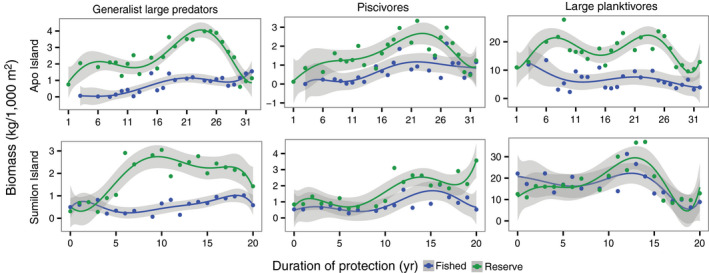
Fig. 3.

Long‐term (1983–2014) temporal trends in biomass of three trophic groups vs. years of protection by no‐take marine reserve (NTMR) status at Apo (upper panels) and Sumilon (lower panels) Islands. These three trophic groups had the clearest evidence of direct NTMR effects. Data points are means, trend lines are sixth‐order polynomials, and shading represents 95% confidence intervals. NTMR sites shown in green and fished sites in blue. Note y‐axis ranges differ among panels.
