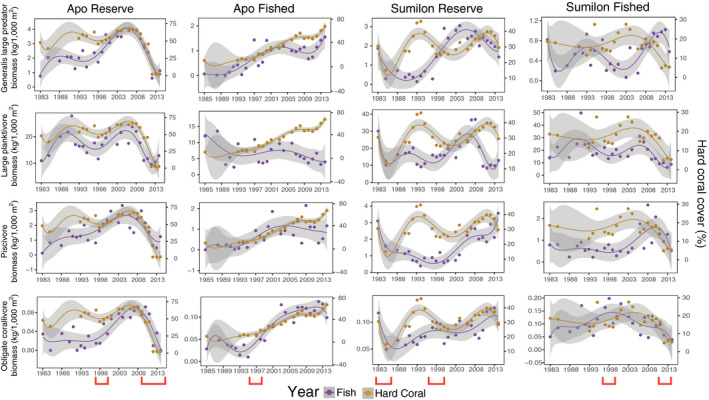
Fig. 5.

Long‐term (1983–2014) temporal trends in biomass (left y‐axis) of four trophic groups of reef fish and live hard coral cover (HC; right y‐axis) at Apo NTMR (first column), Apo fished site (second column), Sumilon NTMR (third column), and Sumilon fished site (fourth column). These are examples of trophic groups that had a generally positive relationship with HC. Data points are means, trend lines are sixth‐order polynomials, and shading represents 95% confidence intervals. Fish biomass is purple and live hard coral is brown. Note y‐axis ranges differ among panels. Environmental disturbances (red brackets) are coral bleaching (1998) at all four sites, local storm (2010) and back‐to‐back typhoons (2011–2012) at Apo NTMR, destructive fishing (1984) at Sumilon NTMR, and typhoon (2012) at Sumilon fished site.
