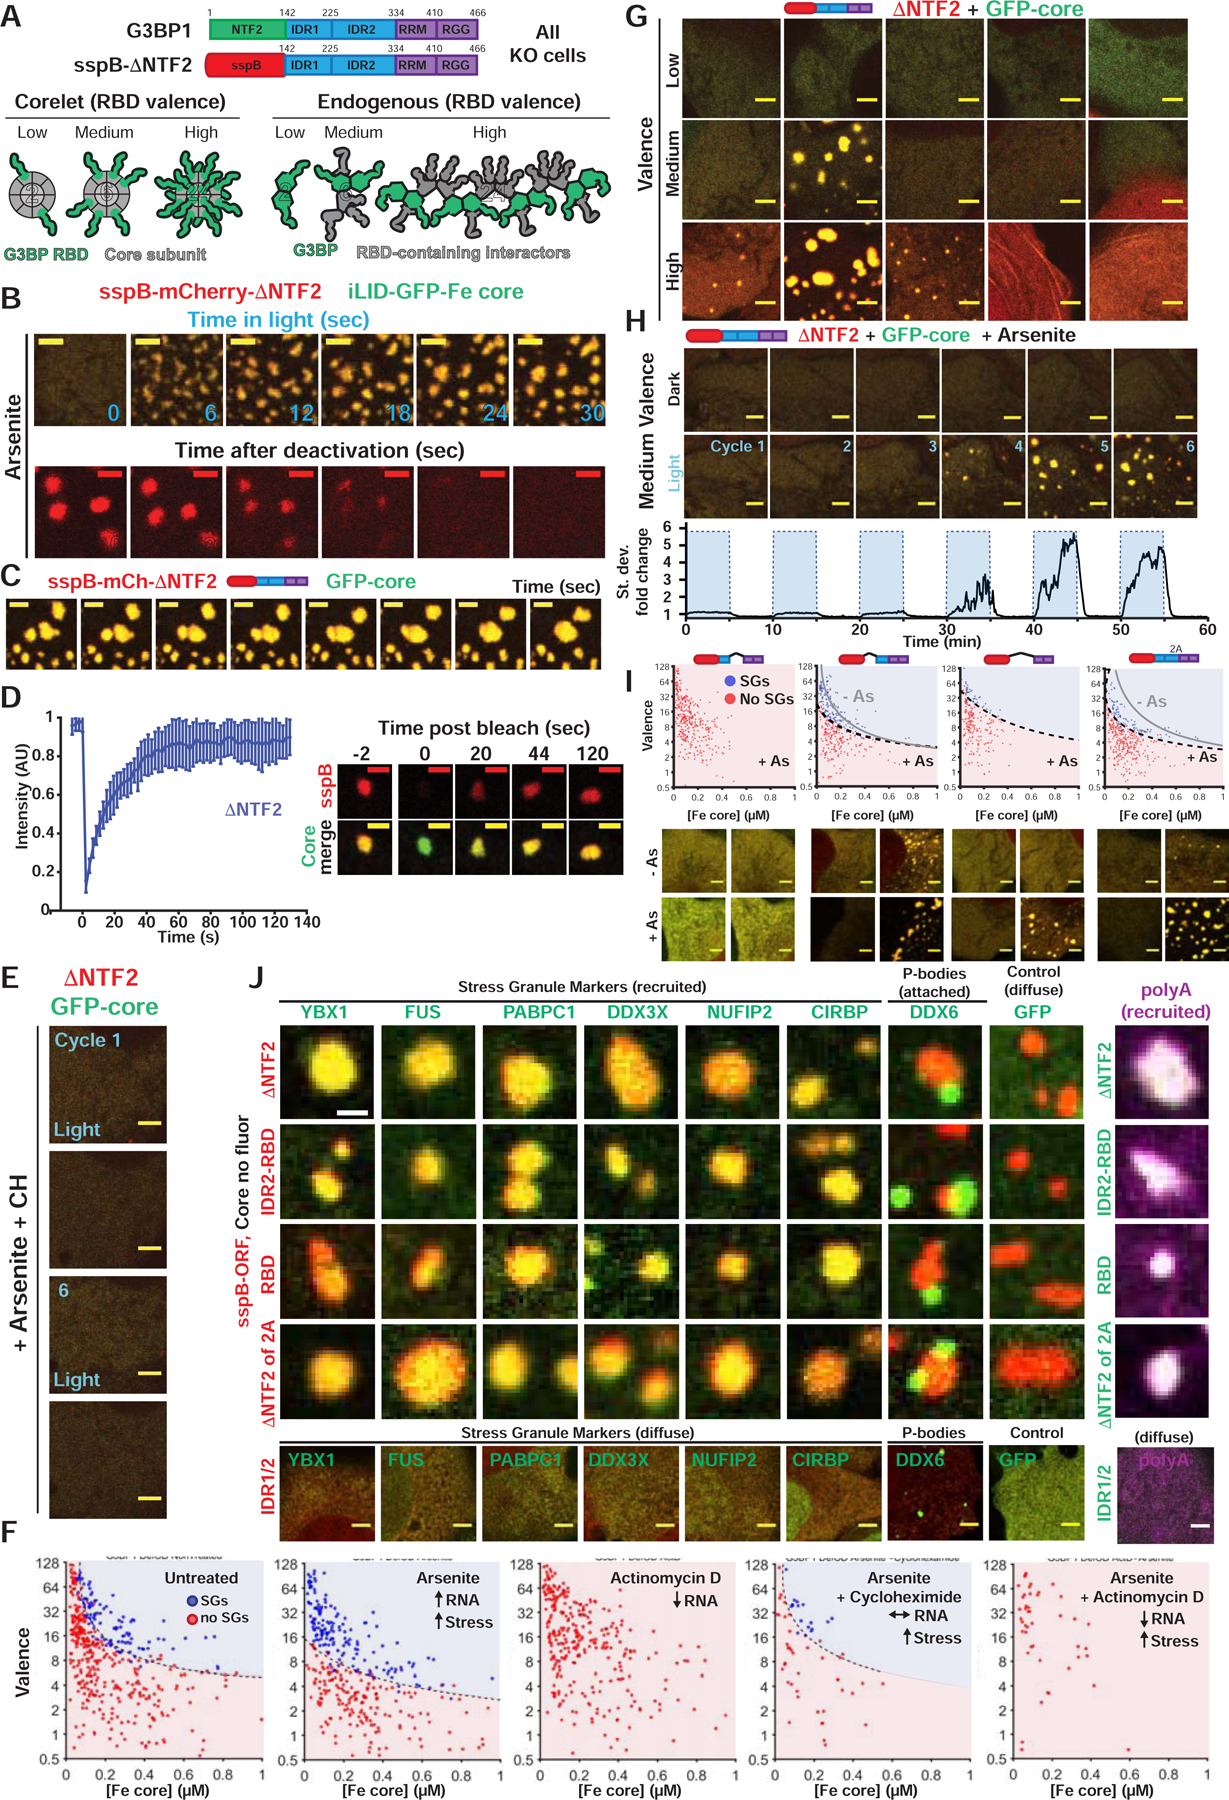
Figure 4. High valence G3BP RBD complexes are sufficient for stress granule formation with attached P-bodies.

(A) Corelets allow optogenetic tuning of vRBD (0 to 24) on a 24-subunit Ferritin (Fe) core to mimic endogenous vRBD of G3BP complex. All Corelet experiments (unless noted): vRBD is denoted low (~2–4), medium (~6–8), or high (~18–24); core ~0.25 μM; cells = G3BP KO U2OS.
(B) Reversible G3BP1ΔNTF2 Corelets after 1-hour As. Indicated: seconds after oligomerization (+blue light) or monomerization (-blue light), scale bar = 3 μm in all images unless noted.
(C) ΔNTF2 Corelets fuse and relax to a sphere following As, activation (3-min). Scale bar, 2 μm.
(D) FRAP of ΔNTF2 Corelets (+As). Intensity relative to fluorescence before granule bleach. Mean and SEM: n=8 experiments. Representative images shown, scale bar = 2 μm.
(E) ΔNTF2 Corelet cells (medium v) treated with cycloheximide (CH) then As (six 10-min cycles: 5-min activate, 5-min deactivate). Images: after cycle.
(F) Intracellular ΔNTF2 Corelet phase diagrams for drugs that alter available RNA. Each dot = single cell (5-min activation), best-fit phase threshold shown.
(G) Representative images for (F).
(H) Similar to (E) but no CH. Standard deviation of pixel intensity relative to first image shown.
(I) Similar to (F) but for additional Δs (+/− As; dots shown for +As). Representative images for high v cells.
(J) GFP-tagged proteins co-expressed with indicated G3BP Corelets (iLID-Fe lacks GFP tag). Following As and 10-min activation, cells were fixed; arrowheads, PBs attached to SGs. Right: oligo-dT RNA FISH (Corelet, green; polyA+ RNA, magenta).
See also Figure S4.
