
Figure 6. Competition between protein-protein interaction nodes encodes multiphase condensation.
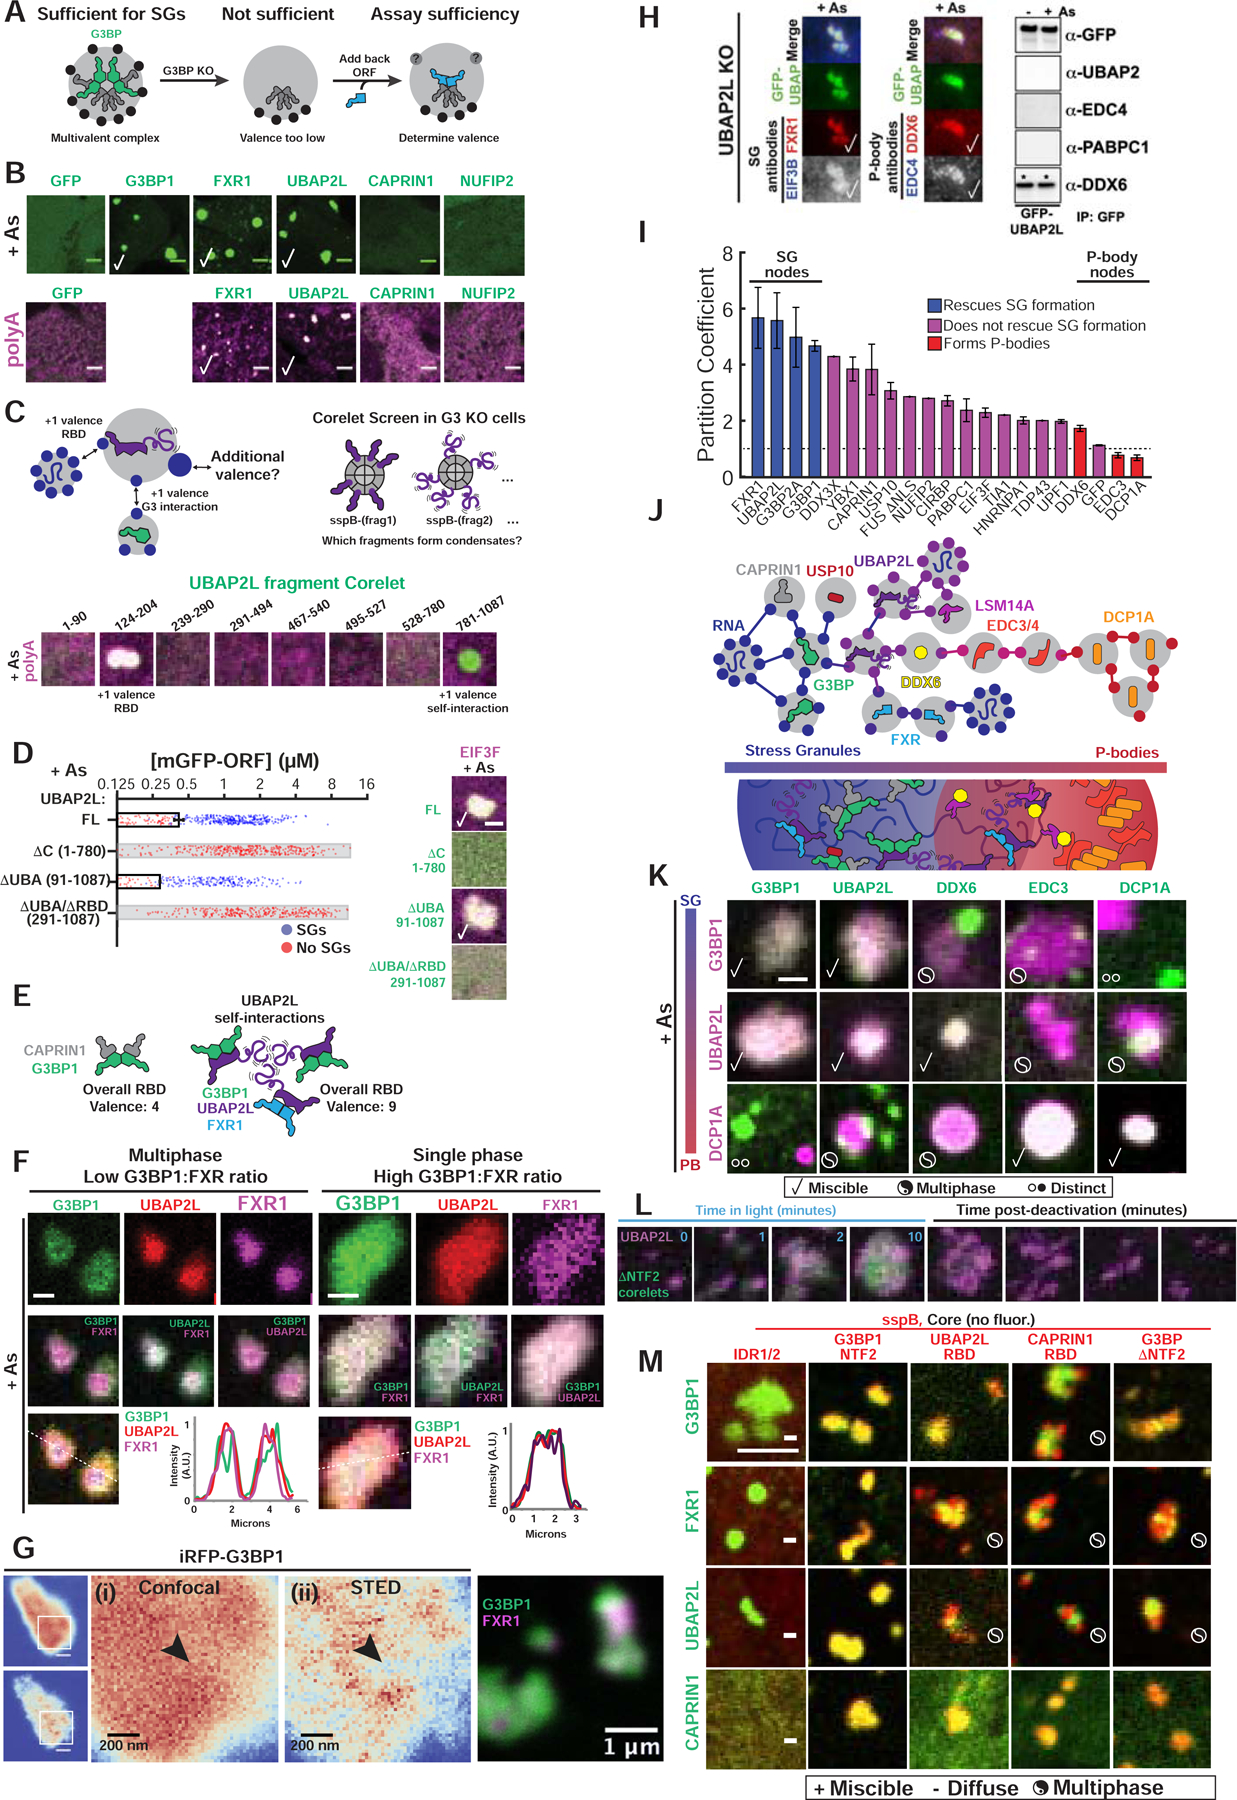
(A) SG proteins compensate for G3BP if acting as v>2 nodes.
(B) Expression (~0.4 μM) of GFP-tagged proteins in G3BP KO cells (+As, oligo-dT RNA FISH). Checks = polyA+ SGs. Scale bar, 3 μm, unless noted.
(C) Corelet screen in G3BP KO cells (+As) to uncover additional valence. Oligo-dT RNA FISH, 10-min activation, fixed. Arrowhead: condensates lack polyA+ mRNA.
(D) G3BP KO cells (+As) expressing GFP-UBAP2LΔs and EIF3F-mCh scored for SGs. Mean and SEM: n=4 experiments (>4 images per). Images: check = SGs, scale bar = 1 μm.
(E) SG formation requires sufficiently high vRBD complexes, which can be achieved partly via self-associating UBAP2L IDRs (purple tails) in different complexes.
(F) Triple co-expression (GFP-G3BP1, mCh-UBAP2L, iRFP-FXR1) in G3BP KO cells (+As). Line traces for single granules shown. Scale bar, 1 μm.
(G) Super-resolution STED of live G3BP KO cells (+As) with <2 μM of either iRFP-G3BP (left) or GFP-G3BP1 and iRFP-FXR1 (right). Arrowhead: G3BP-depleted regions in SGs.
(H) Left: Immunofluorescence of UBAP2L KO cells (+As) with GFP-UBAP2L. Check =co-localization. Right: IP of GFP-UBAP2L (G3BP KO cells +/− As) to detect high-affinity interactions (*).
(I) SG partition coefficients of GFP-tagged proteins in WT cells (+As) with mCh-CAPRIN1. Mean and SEM: n=3 experiments (n>4 images per).
(J) Schematic of how protein interaction network may inform molecular mechanism of multi-phase SG/PBs.
(K) G3BP KO cells (+As) expressing mCh- and GFP-tagged proteins (left to right by network distance from G3BP) pairwise (<2 μM). Legend below. Scale bar, 1 μm.
(L) G3BP KO cells with G3BPΔNTF2 Corelets (green) and UBAP2L-iRFP (<1 μM) were As-treated (1-hour) then activated and deactivated.
(M) G3BP KO cells (+As) expressing panel of Corelets (red; untagged core) and GFP-tagged proteins (green, ~2–3 μM); fixed post-activation (10-min). Scale bar, 3 μm.