Figure 3.

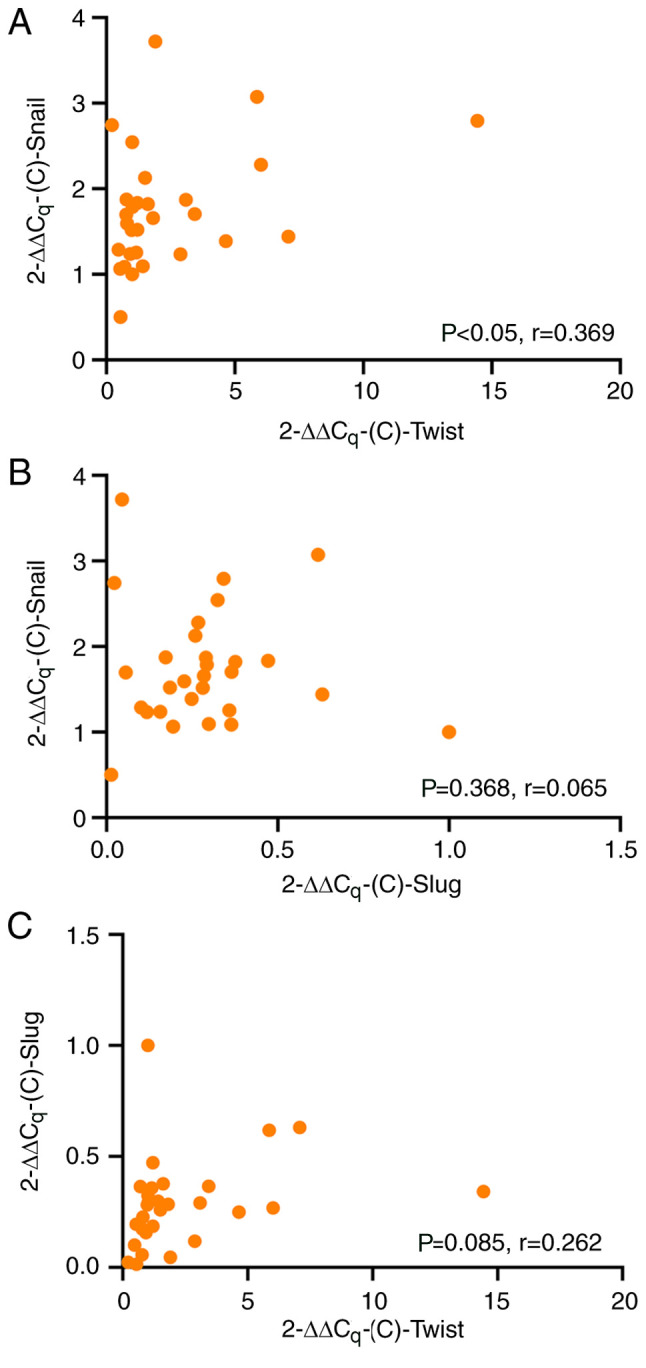
Correlation between mRNA expression levels of Twist, Snail and Slug. Pearson's correlation analysis of the mRNA levels of (A) Twist and Snail, (B) Slug and Snail and (C) Twist and Slug.

Correlation between mRNA expression levels of Twist, Snail and Slug. Pearson's correlation analysis of the mRNA levels of (A) Twist and Snail, (B) Slug and Snail and (C) Twist and Slug.