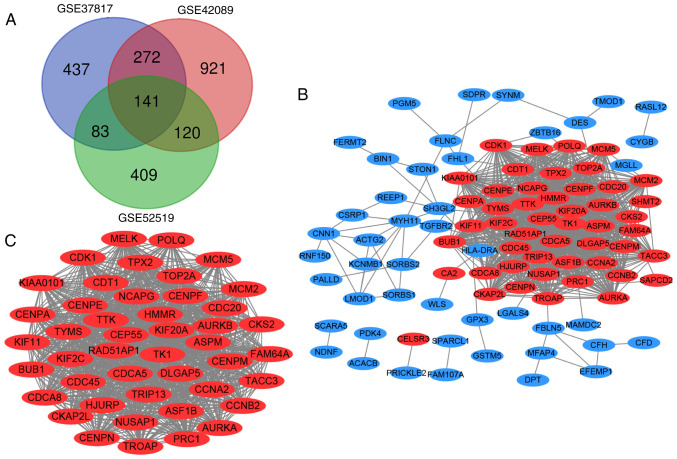
Figure 1.
Venn diagram, PPI network and significant module of DEGs. (A) DEGs were selected among the mRNA expression profiling datasets GSE37817, GSE42089 and GSE52519. These three datasets showed an overlap of 141 genes in the Venn diagram. (B) PPI network of DEGs was constructed using Cytoscape. Red nodes represent upregulated genes, and blue nodes represent downregulated genes. (C) Most significant module was obtained from the PPI network with 45 nodes and 954 edges and exhibited the highest score using the Molecular Complex Detection plug-in. PPI, protein-protein interaction network. DEGs, differentially expressed genes.

