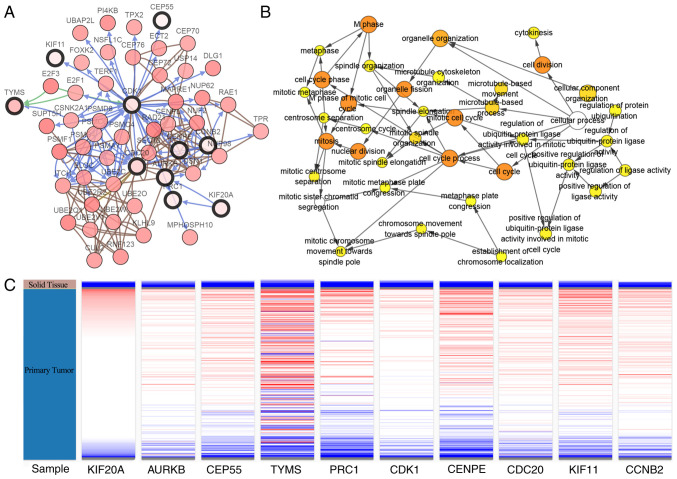
Figure 3.
Interaction network, biological process analysis and hierarchical clustering of the hub genes. (A) Hub genes and their co-expression genes were visualized using the cBioPortal. Nodes with bold black outlines represent hub genes. Nodes with thin black outlines represent co-expression genes. (B) Biological process analysis of hub genes was constructed using the Biological Networks Gene Oncology plug-in. Color depth of the nodes refers to the corrected P-value of ontologies. Size of the nodes refers to the numbers of genes that are involved in the ontologies. P<0.05 was considered statistically significant. (C) Hierarchical clustering of hub genes was constructed using the University of California, Santa Cruz online database. Solid tissue samples above the blue bar are non-cancerous samples and the samples under the brown bar are tumor samples. Upregulation of genes is marked in red; downregulation of genes is marked in blue.

