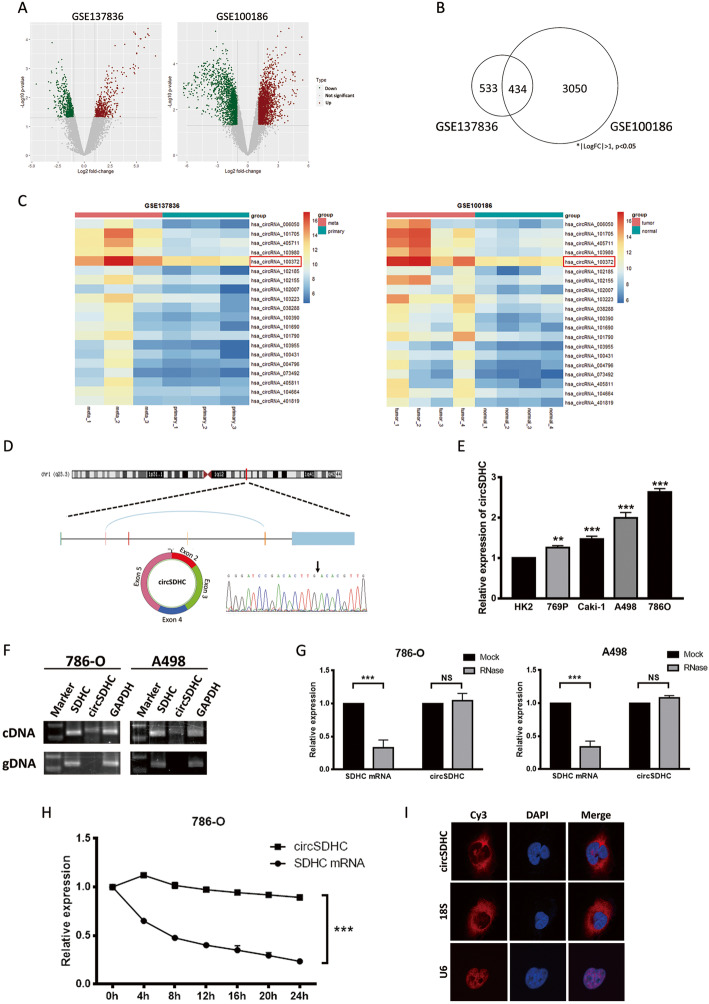
Fig. 1.
Oncogenic circRNAs discovery and characterization of circSDHC in RCC. a. Volcano plot of GSE137836 and GSE100186. Compared to the primary tumors (in GSE137836) and adjacent normal tissue (in GSE100186), red dots represent significantly up-regulated circRNAs, while green dots represent significantly down-regulated circRNAs. Grey dots represent circRNAs that are not significant. b. Venn plot of the two datasets. Common circRNAs with p < 0.05, |log2 (fold change)| > 1 are chosen. c. Heatmaps of the two datasets. The red color represents high expression whereas the blue color represents low expression. d. Schematic illustration of the circSDHC formation from SDHC gene in the chromosome 1. The back splicing junction was verified by Sanger sequencing. Black arrow indicates the specific junction. e. The expression level of circSDHC in normal kidney cell line HK2 and different RCC cell lines, measured by qRT-PCR. f. The existence of circSDHC was confirmed by RT-PCR and gel electrophoresis using convergent and divergent primers. circSDHC can only be amplified in cDNA. GAPDH serves as control. g. Stability of circSDHC and linear SDHC was assessed by RNase treatment followed by qRT-PCR. h. Stability of circSDHC and linear SDHC was assessed by Actinomycin D treatment followed by qRT-PCR at different time points. i. Cellular localization of circSDHC was detected by FISH. Nuclear was label with DAPI dye. The majority of circSDHC is within the cytoplasm. Data are mean ± SD, n = 3

