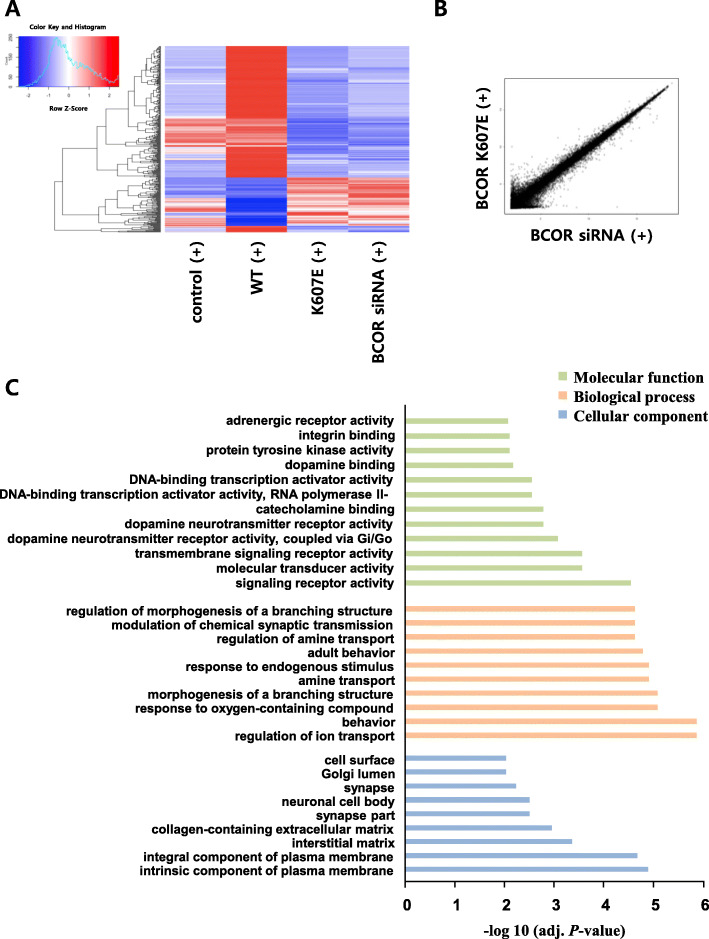
Fig. 4.
Gene expression profiles of BCOR mutant expressing cells. a Heat map of genes with 1.5-fold as well as P < 0.05 mRNA expression differences between wild-type BCOR and BCOR K607E mutant expressing cells stimulated with PMA and ionomycin. Ninety genes were up-regulated and 256 genes were down-regulated. b Scatterplot representation of correlation between cells expressing the BCOR K607E mutant and transfected BCOR siRNA. c Molecular functions, biological processes, and cellular components that were upregulated in the BCOR K607E mutant expressing cells as compared to cells expressing the wild-type BCOR, determined via GO analysis of genes

