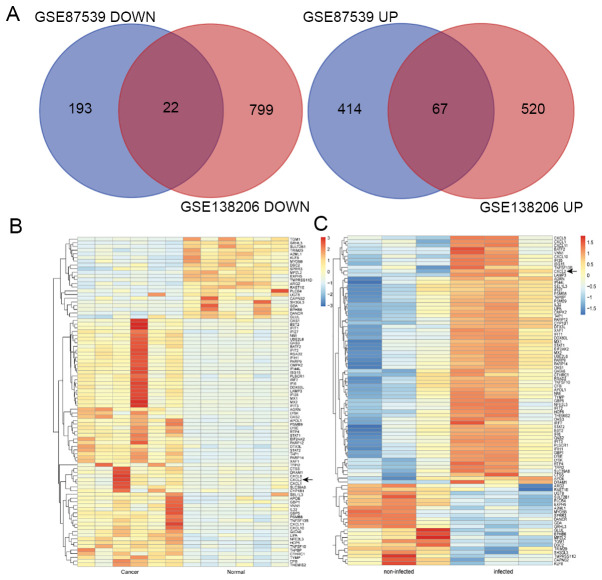
Figure 2.
Venn diagrams and heat map of DEGs. CXCL2 was one of the DEGs included in the two datasets. (A) DEGs with a fold-change >2 and P<0.01 were selected in the gene expression profile datasets (GSE87539 and GSE138206). The two datasets had an overlap of 89 genes, including 67 upregulated genes and 22 downregulated genes. (B) The six samples on the left were carcinoma tissues and the six samples on the right were non-carcinoma tissues. Upregulation of genes is indicated in red, and downregulation of genes is indicated in blue. (C) Hierarchical clustering of DEGs was performed using UCSC. The three samples on the left were non-infected oral epithelium tissues and the three samples on the right were Porphyromonas gingivalis-infected tissues (black arrows indicate CXCL2). DEGs, differentially expressed genes; CXCL2, C-X-C motif chemokine ligand 2.

