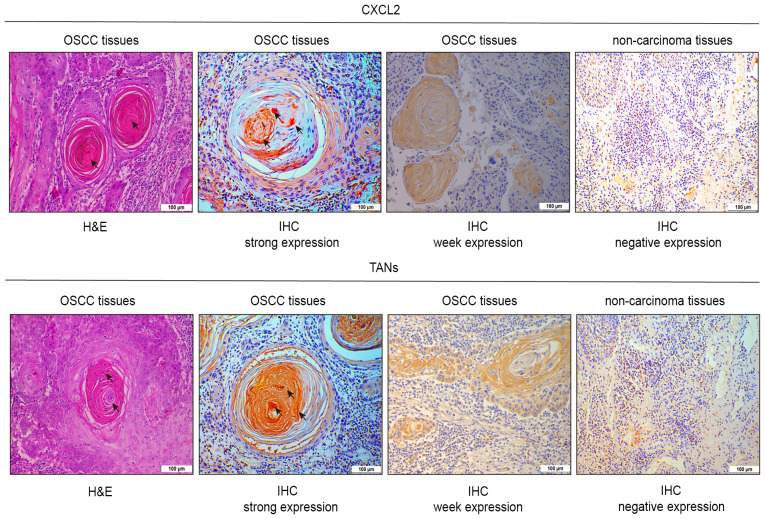
Figure 3.
H&E staining of CXCL2 and TANs in OSCC tissues, strong CXCL2 and TANs expression in OSCC tissues, weak CXCL2 and TANs expression in OSCC tissues, and negative CXCL2 and TANs expression in non-carcinoma tissues. Scale bars, 100 µm. OSCC, oral squamous cell carcinoma; CXCL2, C-X-C motif chemokine ligand 2; TANs, tumor-associated neutrophils; IHC, immunohistochemistry.

