Fig. 3.
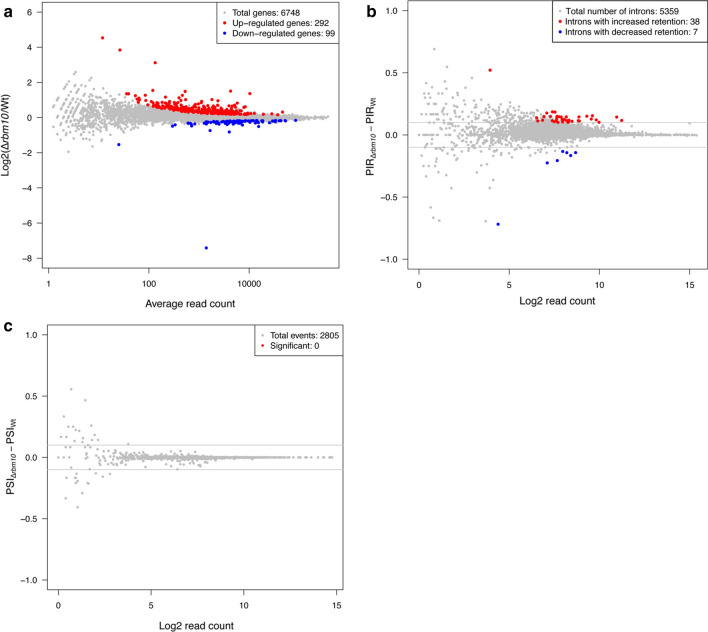
Deletion of Rbm10 has minor effect on gene expression and intron retention. a MA plot comparing the gene expression patterns between rbm10Δ cells and WT. The average read count for each gene was plotted on the X axis, and the log2 transformed fold change was on the Y axis. The red and blue dots represented the genes with significantly different gene expression patterns. b MA plot comparing the intron retention patterns between rbm10Δ cells and WT. Log2 transformed read count for each event was plotted on the X axis, and the PIR difference was on the Y axis. The red and blue dots represented the events with significantly different intron retention patterns. The grey lines indicate 10% PIR difference. c MA plot comparing the exon skipping patterns between rbm10Δ cells and WT. Log2 transformed read count for each event was plotted on the X axis, and the Percent Spliced In difference (ΔPSI) was on the Y axis. The red dots represented the events with significantly different exon skipping patterns. The grey lines indicate 10% PIR (Percent Intron Retained) difference

