
Figure 1. The Proteome of SGs Revealed by Multi-bait Proximity Labeling.
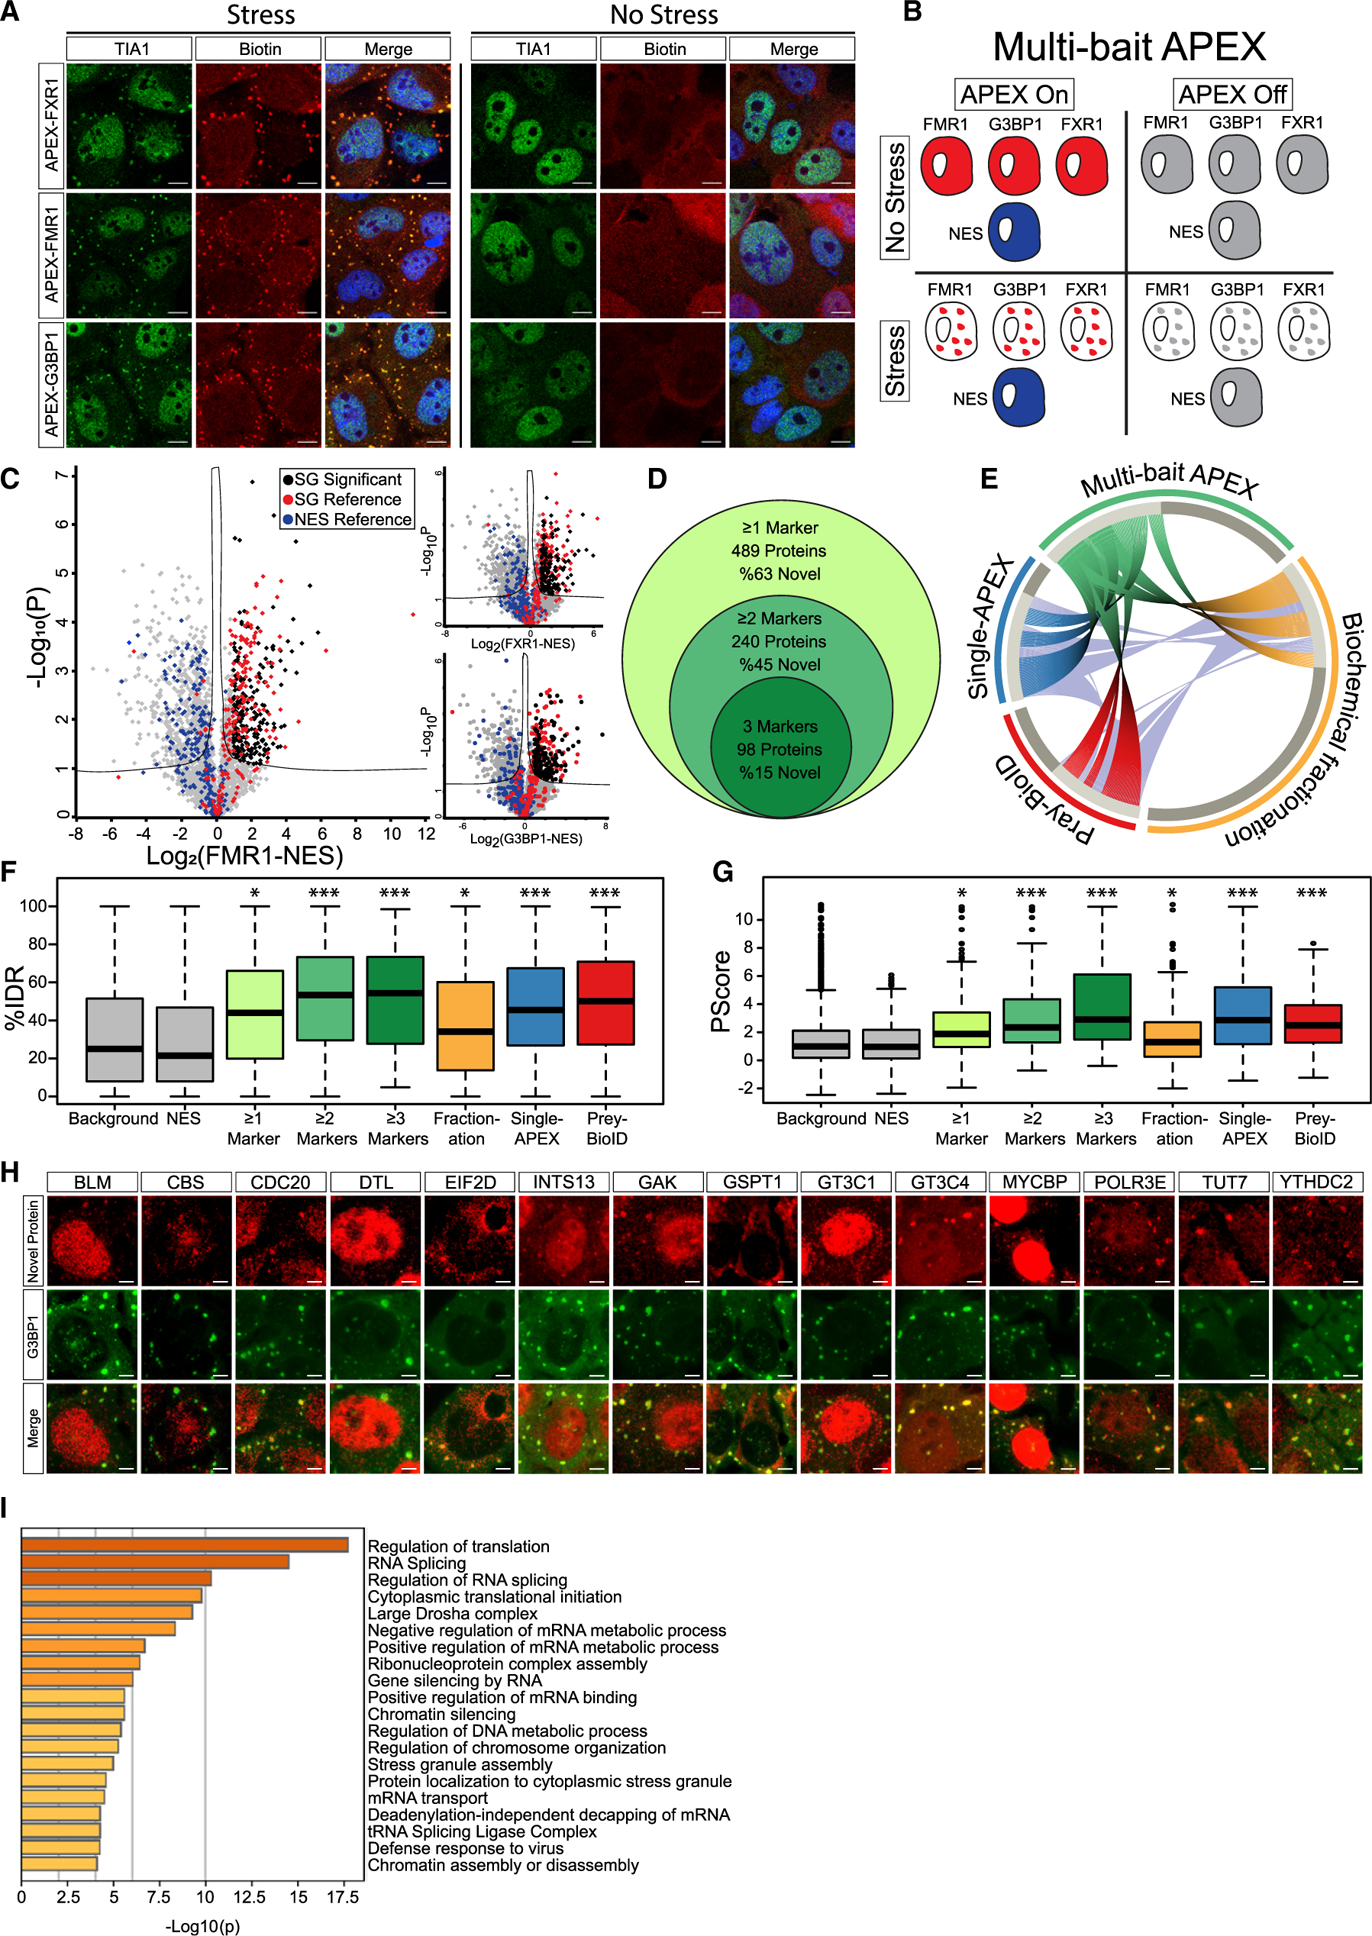
(A) Confocal micrographs depicting FXR1-APEX, FMR1-APEX, or G3BP1-APEX activity in U2OS cells, with or without sodium arsenite stress (NaAsO2 400 μM, 30 min). Immunofluorescence depiction of TIA1, neutravidin-Texas-red staining of biotinylated proteins at the proximity of the APEX bait, and merged signal demonstrating the precise localization of the APEX activity in stress granules (SGs). Lens, ×63; scale bar, 10 μm.
(B) Diagram of experimental design. Study with U2OS cells that stably express FXR1-APEX, FMR1-APEX, G3BP1-APEX, or cytoplasmic NES-APEX. SG baits are diffusible in the cytoplasm without stress. NES-APEX remains diffusively cytoplasmic under stress conditions (NaAsO2 400 μM, 30 min.), while FXR1-APEX, FMR1-APEX, and G3BP1-APEX are recruited to SGs. APEX on: APEX peroxidase activity, induced by H2O2, causes BP radical formation that tags biomolecules in the bait vicinity with a biotin moiety. APEX off: control for nonspecific activity without BP. Experiments were performed in triplicates.
(C) Volcano plots of relative protein levels in SG APEX relative to NES-APEX samples under stress conditions (x axis log2 scale), analyzed by MS. y axis depicts the differential expression p values (−log10 scale). Black, novel SG proteins above specific marker cutoff (FMR1 = 0.96, FXR1 = 0.89, and G3BP1 = 0.88), relative to NES. Student’s t test with correction to multiple hypothesis by FDR adjusted p < 0.05; red/blue, previously known SG proteins/cytoplasmic organellar proteins.
(D) Venn diagram of multi-bait SG analysis and embedded results, revealing proteins identified by at least a single SG bait (associated with FXR1 and/or FMR1 and/or G3BP1), at least two baits, or all three baits together.
(E) Circos plot of proteome depicted by at least two baits in our multi-bait APEX study (green), single bait G3BP1-APEX (Markmiller et al., 2018), biochemical fractionation (Jain et al., 2016), or indirect (pray) analysis of data from BioID studies (Youn et al., 2018). Substantial overlap with previously known SG proteome is accompanied by the discovery of 109 novel and internally cross-validated proteins.
(F) Boxplot of intrinsically disordered region (IDR) enrichment (%IDR, by IUPred; Mészáros et al., 2018) in the data of the current study and others (Jain et al., 2016; Markmiller et al., 2018; Youn et al., 2018). Background shows all proteins identified in our MS analyses. Upper and lower quartiles and extreme points are shown. Wilcoxon signed-rank test p < 0.005.
(G) Boxplot of SG proteome propensity to phase separate (Pscore; Vernon et al., 2018) in the data of the current study and others as in (F). Upper and lower quartiles and extreme points are shown. ANOVA with Tukey post hoc test p < 0.05.
(H) Confocal micrographs of immune-fluorescent detection of novel SG proteins in U2OS cells under stress conditions, and co-localization with the G3BP1 SG marker. Scale bar, 10 μm.
(I) Bar graph depicting the significance of enrichment in the top 20 Gene Ontology (GO) terms for the SG proteome (−log p value) by Metascape (Zhou et al., 2019).