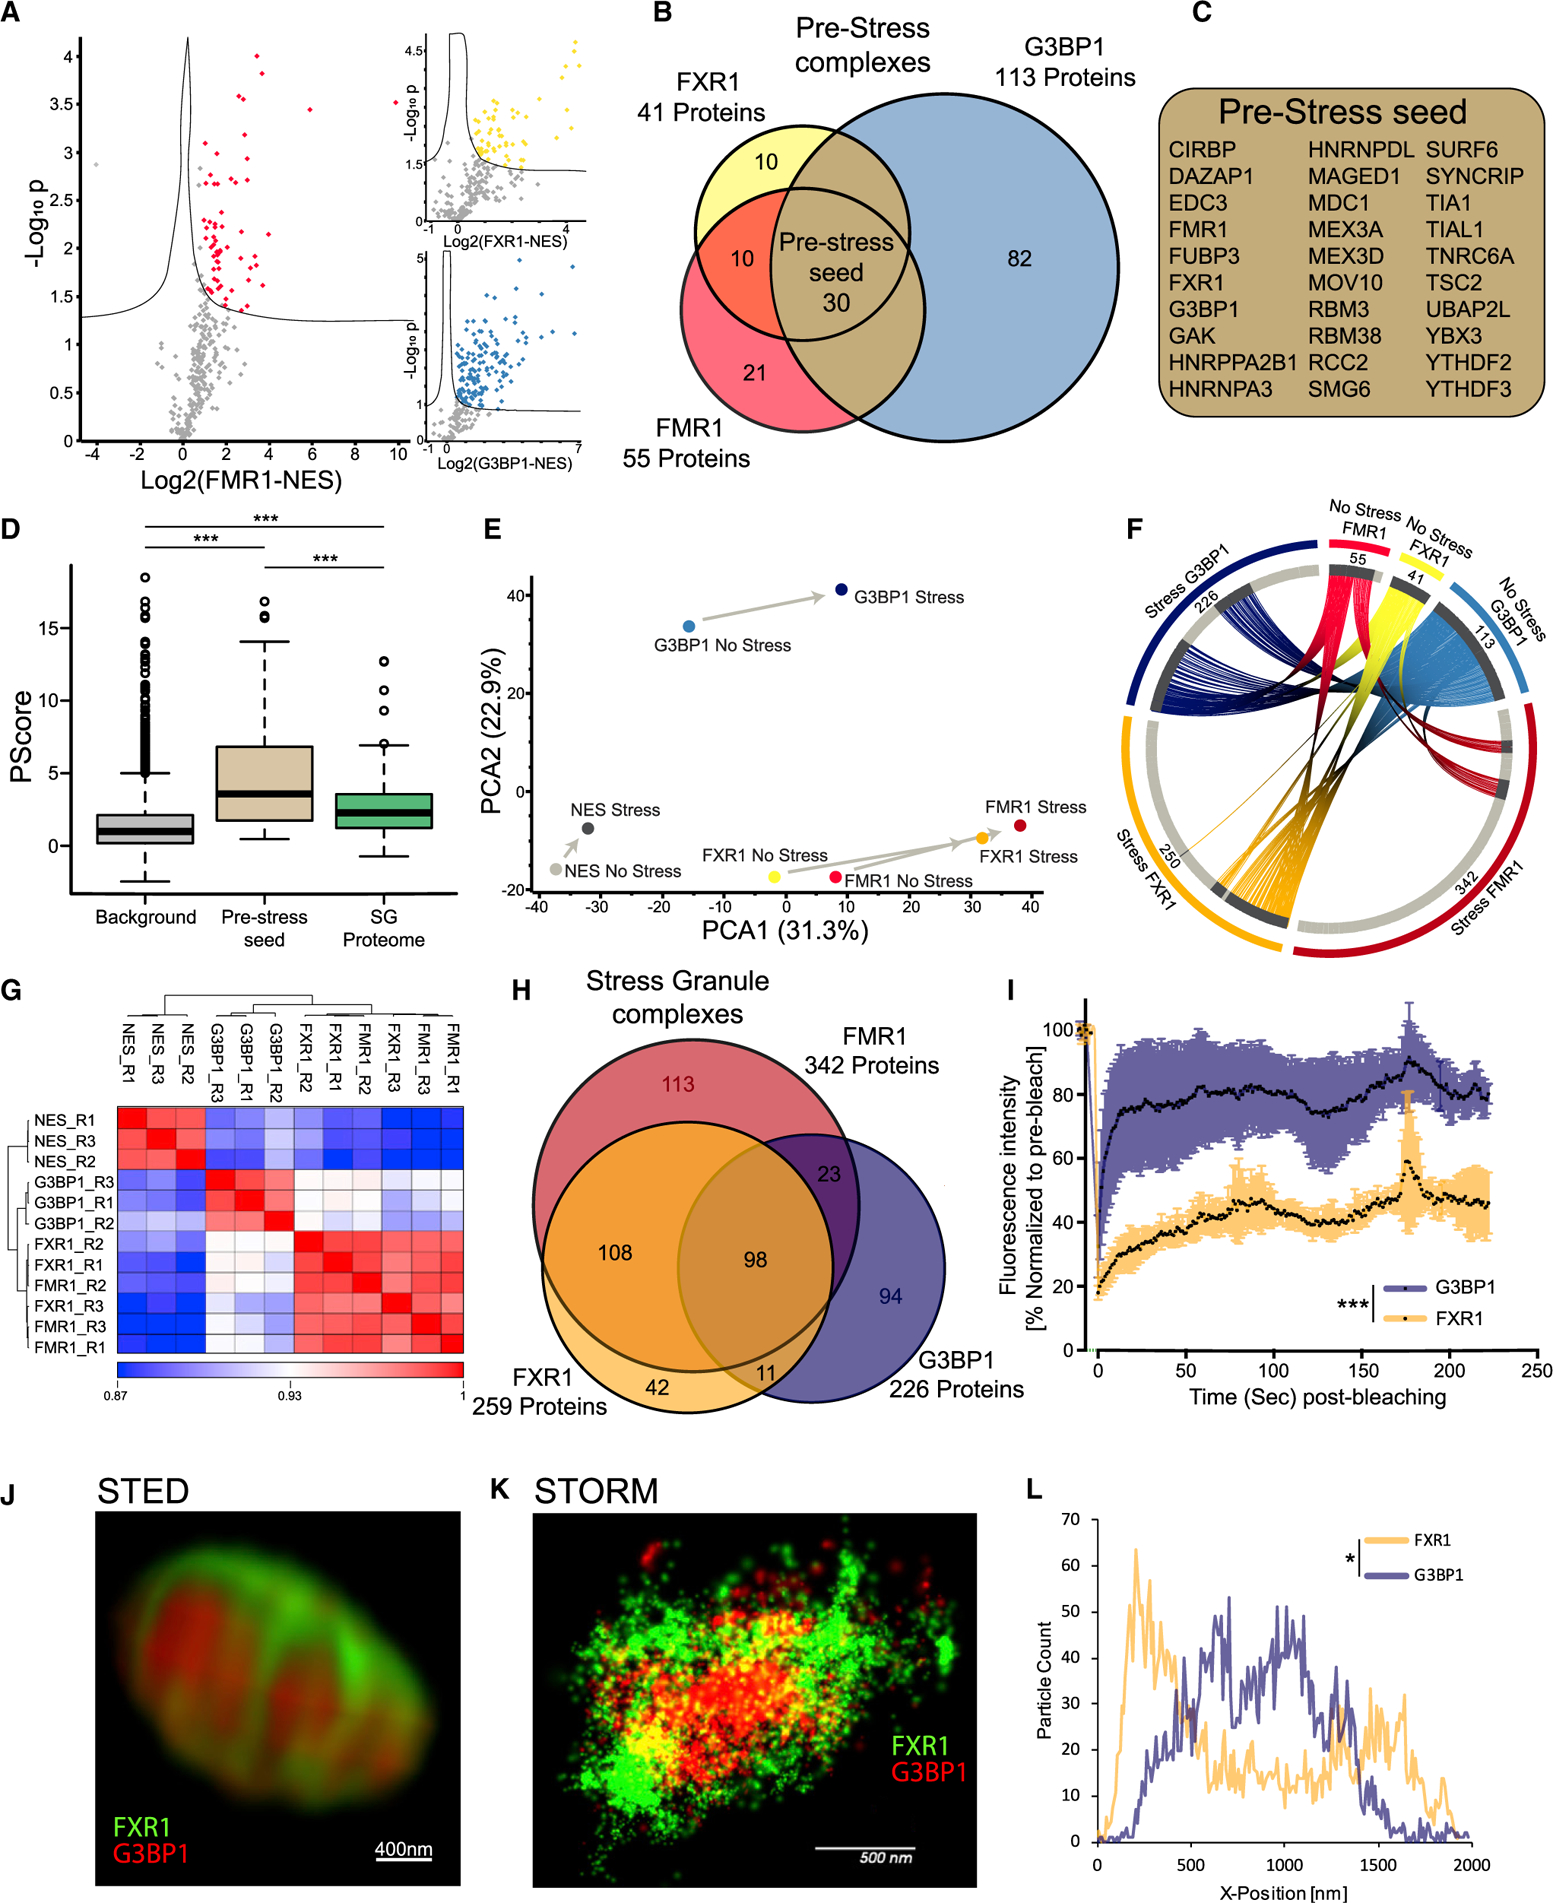
Figure 2. APEX Study of Proteome Composition Reveals the Emergence of Distinct SG Substructures.

(A) Volcano plots of protein levels in FMR1, FXR1, or G3BP1 APEX samples relative to NES-APEX samples (x axis log2 scale) under non-stress conditions. y axis depicts the differential expression p values (−log10 scale). Red/yellow/blue features: proteins associated with APEX markers with at least 2-fold enrichment above values in NES. Student t test with correction to multiple hypothesis by FDR adjusted p < 0.05.
(B) Venn diagram of FMR1, FXR1, and G3BP1 proteomes under basal conditions, with the number of proteins demarcated.
(C) List of 30 pre-stress seed proteins identified by three markers in basal, pre-stress conditions.
(D) Boxplot analysis of propensity to phase separate (calculated by Pscore; Vernon et al., 2018) in the background (all proteins identified in our MS analysis, pre-stress seed [30 proteins]) and 240 proteins internally validated in mature SGs. Upper and lower quartiles and extreme points are shown. ANOVA with Tukey post hoc test p < 0.0005.
(E) Principal-component analysis (PCA) of FMR1, FXR1, G3BP1, and NES proteomes with or without stress. Minimal compositional changes in the NES proteome influenced by stress (depicted as short principal component vector), in contrast to more substantial compositional changes in the FMR1, FXR1, and G3BP1 proteomes, are shown. FMR1 and FXR1 proteomes collide.
(F) Circos plot of proteins identified in basal and stress conditions, per each SG-APEX bait. Approximately 52% of the proteins associated with G3BP1 under stress are already residents of the pre-stress G3BP1 complexes, whereas most of the proteins (84%) associated with FMR1/FXR1 assemble de novo with stress.
(G) Unsupervised clustering of Pearson correlation values for proteomes captured by SG APEX baits during stress. High similarity was found between FMR1 and FXR1 proteomes, which are distinct from the G3BP1 and NES proteomes. R1–3 are the three experimental replicates for each APEX bait.
(H) Venn diagram of FMR1, FXR1, and G3BP1 proteomes in stress conditions, with the number of proteins demarcated.
(I) Fluorescence recovery of SGs after photobleaching in U2OS cells that co-express G3BP1-RFP and FXR1-YFP. Laser bleaching was defined as time 0, and snapshots were taken every 1 s. The recovery of G3BP1-RFP was monitored at ~5 s, whereas FXR1-GFP did not completely recover, even after 200 s. Mean intensity presented as the percent of the average pre-bleach signal normalized to unbleached SGs and corrected for background fluorescence. Unpaired t test with Welch’s correction *** p<0.0001. See also Video S1.
(J) Dual-color stimulated emission depletion microscopy (STED) of FXR1 (green) and G3BP1 (red) in U2OS cells. 93× lens. Scale bar, 400 nm.
(K) Dual-color stochastic optical reconstruction microscopy (STORM) of FXR1 (green) and G3BP1 (red) in U2OS cells, captured at 4,000 frames/channel. 60× lens. Scale bar, 500 nm.
(L) Representative particle count per normalized SG position (x axis) from the STORM study. Total counts are shown on the y axis, normalized between the FXR1 (green) and G3BP1 (red) channels. Distribution of particles between channels is statistically different by ANOVA of 15 SGs (Figure S3C). p < 0.05. See also Video S2.
