
Figure 4. SUMOylation Controls SG Formation and Disassembly.
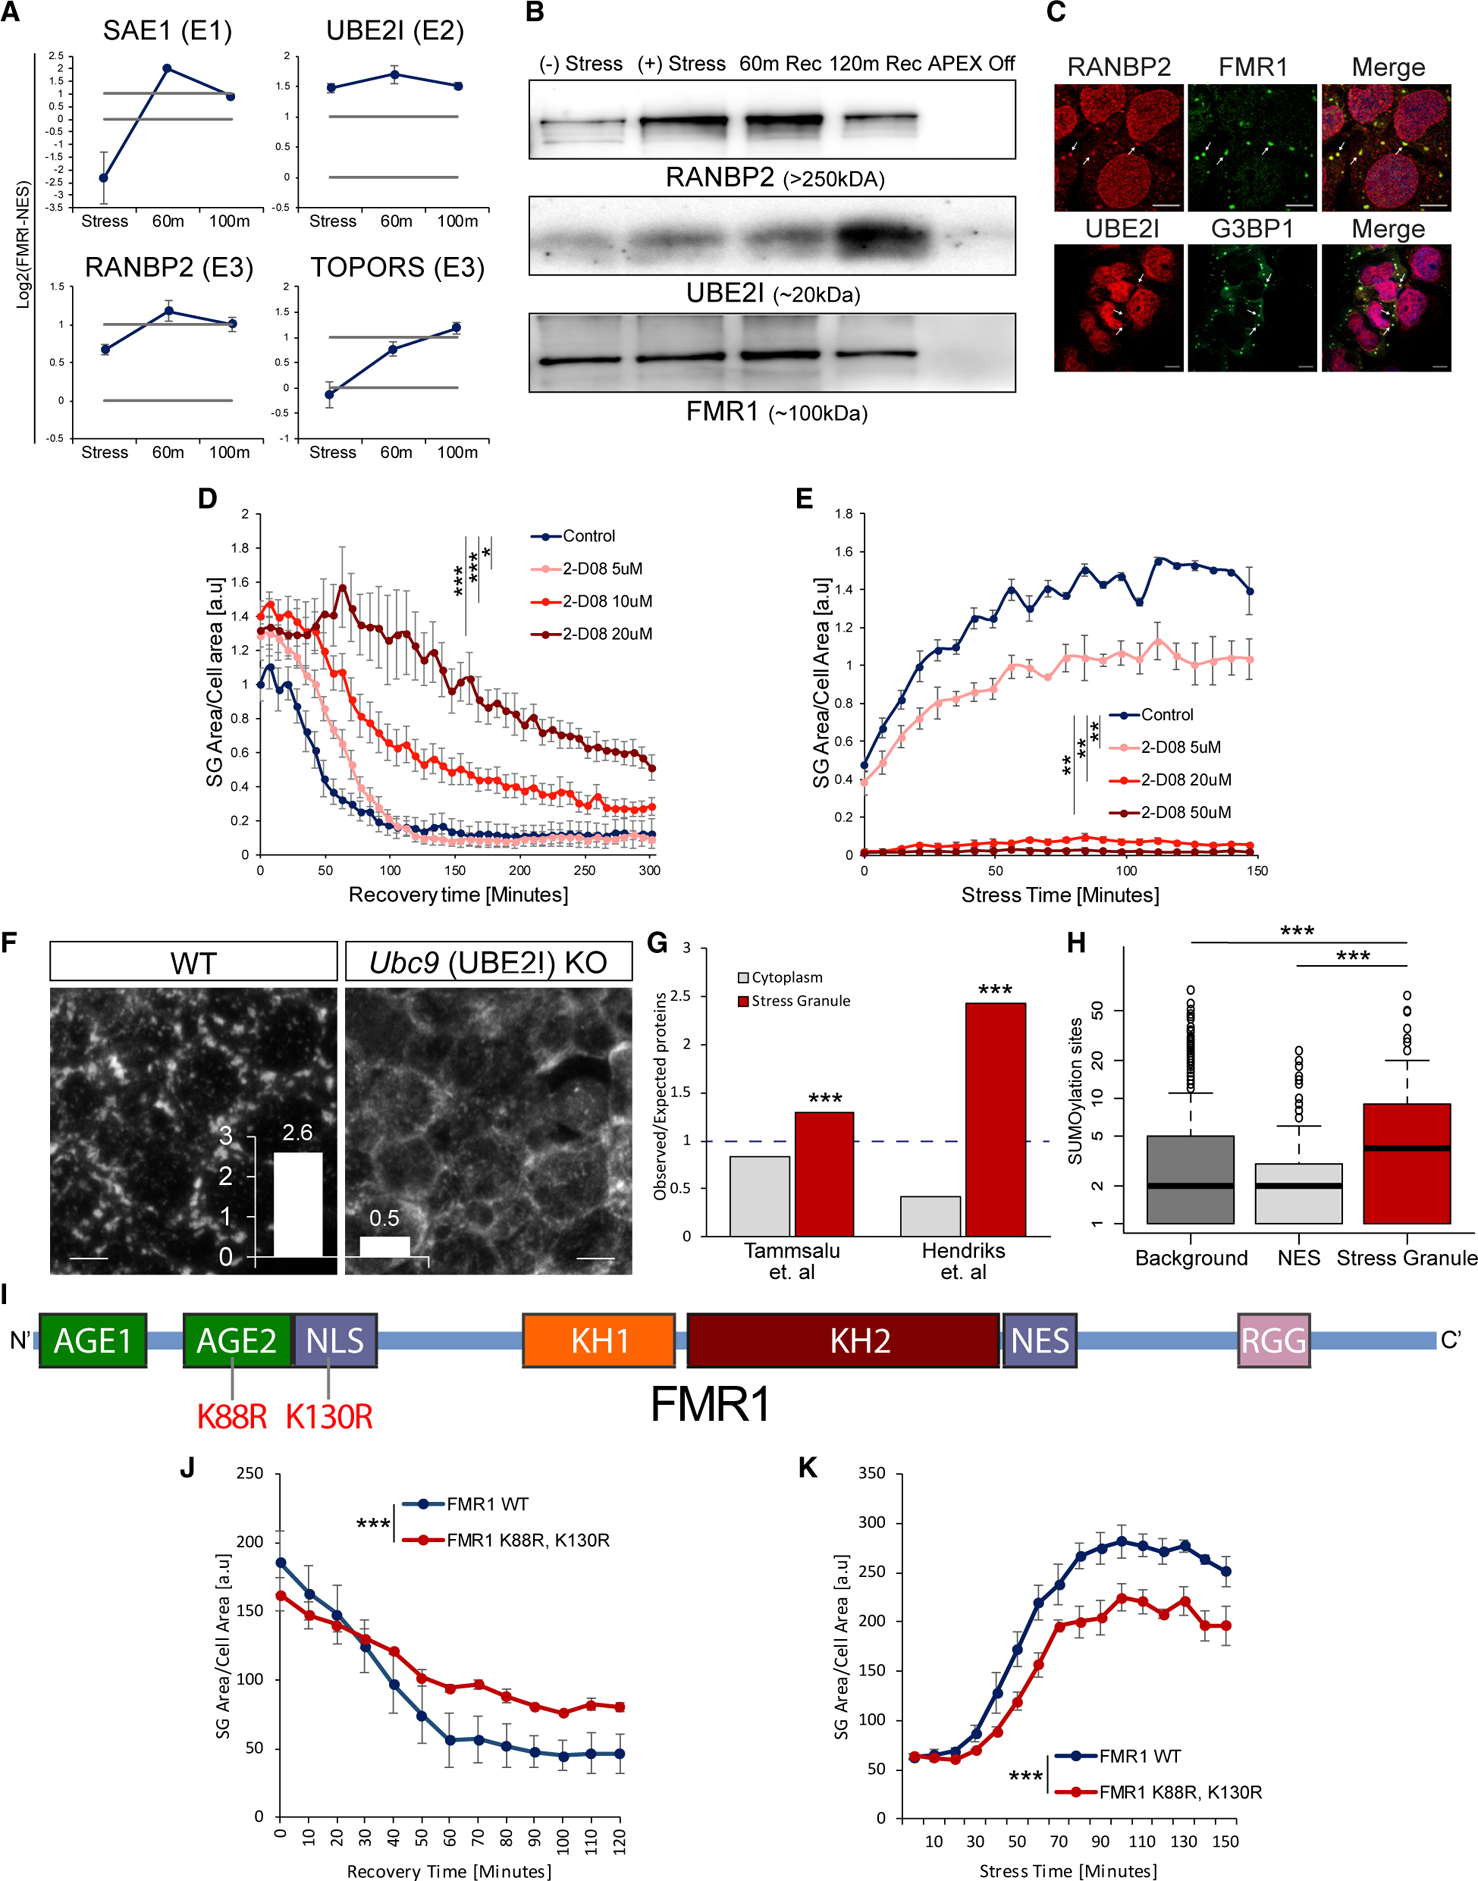
(A) Graphs of MS quantification of UBE2I, SAE1, TOPORS, and RANBP2 in U2OS SGs. Log2 fold change of label-free quantification (LFQ) intensity in FMR1 minus NES in stress conditions and two time points after washout. Lower bar shows levels in the cytoplasm; higher bar shows 2-fold enrichment. Data are presented as mean ± SEM.
(B) Western blot analysis after FMR1-APEX activity and streptavidin pull-down of biotinylated SG proteins for detection of RANBP2, UBE2I, and FMR1-APEX as loading reference. RANBP2 and UBE2I are present in SGs in response to stress and during recovery.
(C) Immunofluorescence analysis of RANBP2 and UBE2I localization in SGs. FMR1 or G3BP1 as SG markers. Merge includes demarcated nucleus (blue, DAPI). Lens ×63. Scale bar, 10 μm.
(D and E) Graph quantification of SG dynamics by live GFP-G3BP1 imaging with increasing concentrations of 2D08, a SUMOylation inhibitor. Stress induced with sodium arsenite (300 μm, for 30 min), washed out, and 2D08 was introduced (D), or 2D08 was introduced 4 h prior to induction of stress with sodium arsenite (200 μm, for 30 min) (E). SG area, normalized to cellular area (y axis), as a function of time (x axis). Repeated-measures ANOVA, * p < 0.05. ** p < 0.005, *** p<0.0005. Three experimental repeats for measurement with four different areas per well. Representative experiment from more than three independent live-imaging studies. See also Video S3.
(F) Representative images of anti-G3BP1 immunofluorescence in mouse embryonic stem cells, in which Ubc9 is conditionally nullified. Stress by sodium arsenite (300 μm, for 30 min) and quantification of SG/cell; scale bar, 10 μm.
(G) Bar graph of SUMO enrichment (expected/observed) in the SG proteome or the cytoplasm, based on SUMO moieties, characterized by Tammasalu et al. (a list of 539 proteins; Tammsalu et al., 2014) or Hendriks et al. (a list of 3,872 proteins; Hendriks et al., 2017). Hypergeometric test p < 0.0001 for both datasets.
(H) Boxplot of typical number of SUMOylated sites in total proteins identified by MS (background), cytoplasm (NES), and SG proteomes (based on Hendriks et al., 2017). p < 0.0005, Wilcoxon signed-rank test.
(I) Diagram of the FMR1 protein with main functional domains based on Prieto et al. (2020). Lysine 88 (K88) in the second N-terminal Agenet domain (AGE2) and lysine 130 (K130) of the nuclear localization signal (NLS) are known to be SUMOylated and were substituted for arginines.
(J and K) Graph quantification of SG dynamics by live GFP-FMR1 imaging with wild-type, K88R, and the K130R form of FMR1. Disassembly kinetics after washing out sodium arsenite (300 μm, for 30 min) (J), or SG formation kinetics after adding sodium arsenite (200 μm) (K). SG area, normalized to cellular area (y axis), as a function of time (x axis). Repeated-measures ANOVA, p < 0.0005. Three experimental repeats for measurement with four different areas per well. Representative experiment from more than three independent live-imaging studies.