
Figure 5. Temporal Resolution of SG Disassembly with C9-ALS-Associated Dipeptides.
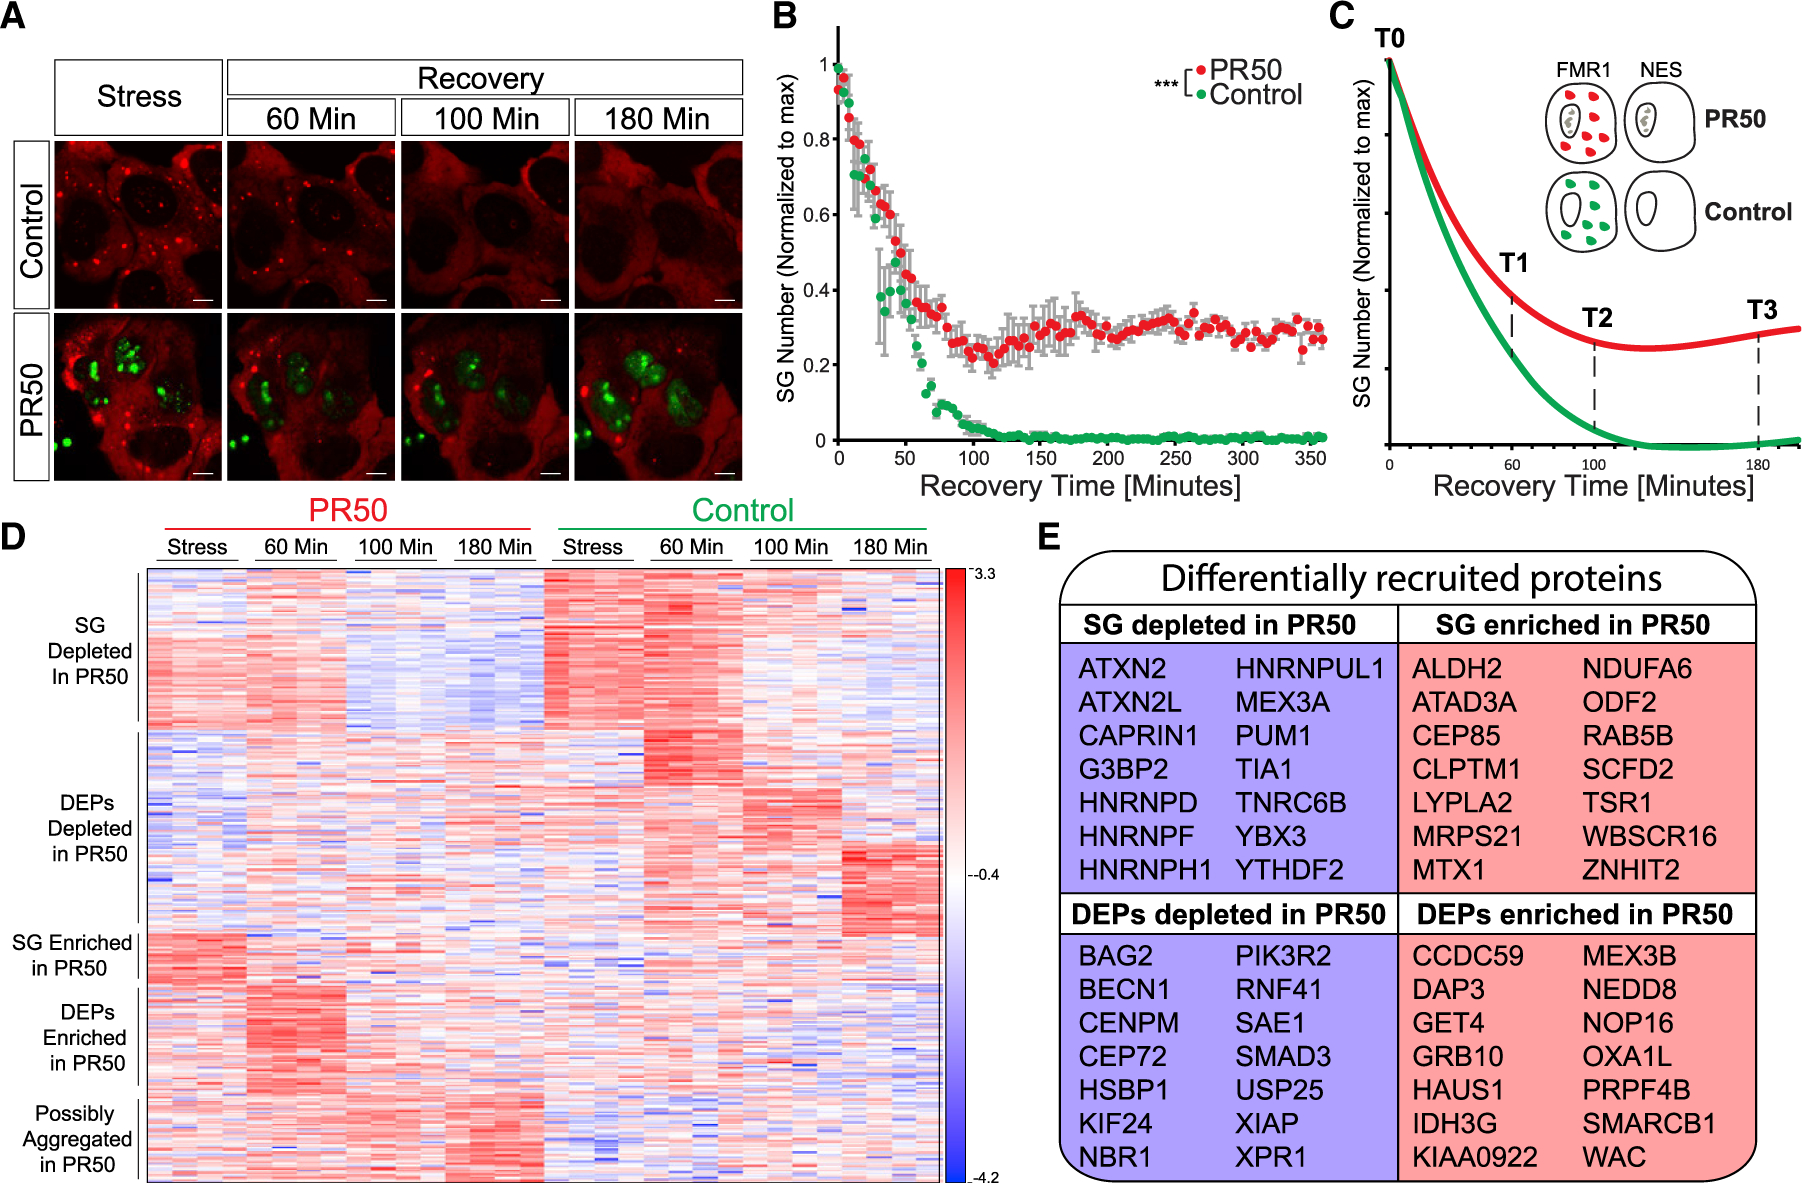
(A) Representative micrographs depicting RFP-G3BP1 in stressed U2OS cells that express GFP-poly(PR)50 and during recovery, after the stressor was washed out. Scale bar, 10 μm. See also Video S4.
(B) Graph quantification of SG disassembly dynamics by live Cherry-G3BP1 imaging after stressor washout with inducible GFP (control) or GFP-poly(PR)50 expression (PR50). SG number, normalized to maximal SG numbers per field (y axis) as a function of time after stress washout (x axis). Three experimental repeats for measurement with four different areas per well. Representative experiment from more than three independent live-imaging studies. ANOVA repeated-measurement p < 0.0005.
(C) Diagram of study design. Inducible FMR1-APEX or NES-APEX baits, with inducible GFP (control) or GFP-poly(PR)50 expression (PR50). APEX proximity labeling activity was induced at T0 (during stress) or at three time points after washout.
(D) Heatmap of unsupervised clustering of proteins that were differentially associated with SGs under normal conditions and with expression of GFP-poly(PR)50 during the course of disassembly. SG relative to cytoplasm (FMR1-APEX/NES-APEX 2-fold change) and GFP-poly(PR)50/GFP (control) by two-way ANOVA with FDR p < 0.05.
(E) A subset from the 425 proteins that were differentially associated (176 enriched/249 depleted) with SG during disassembly, with expression of GFP-poly(PR)50, relative to control conditions.