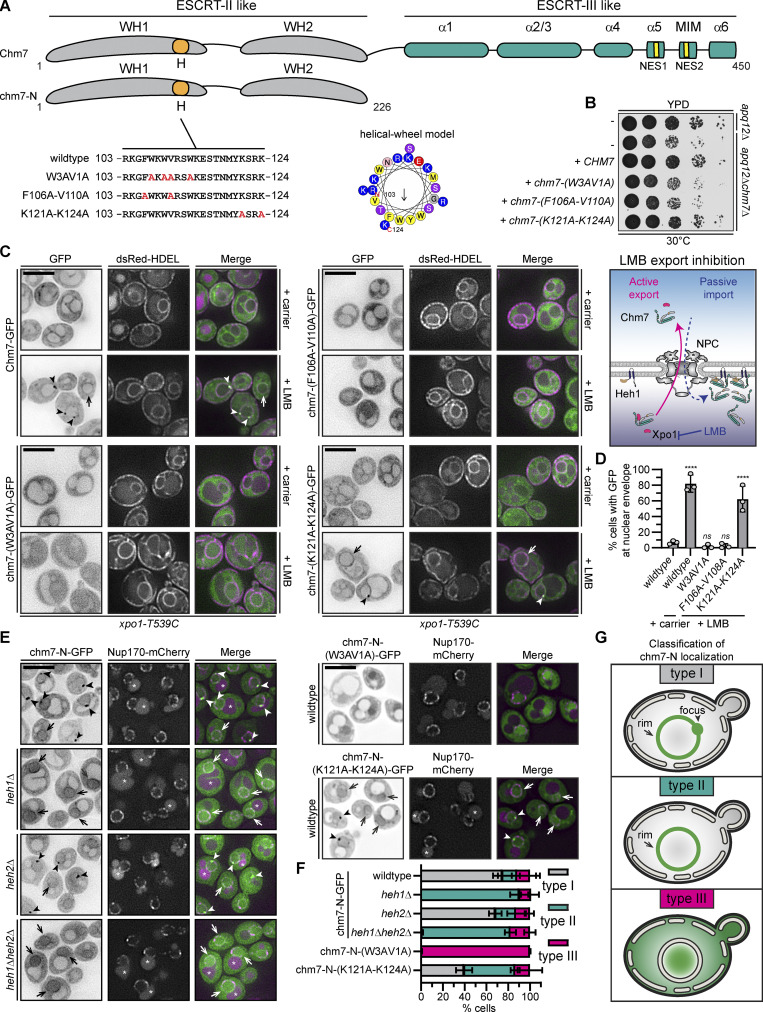
Figure 1.
Chm7 interacts with the INM through a conserved hydrophobic stretch of amino acids. (A) Schematic of Chm7 and chm7-N with predicted winged helices (WHs), hydrophobic stretch (H), α helices (α), MIT-interacting motif (MIM), and NESs. Amino acid sequences encoded by alleles (with names at left) of CHM7 with amino acid changes indicated in red in the H sequence. In the middle is a helical wheel model of H generated with HeliQuest (Gautier et al., 2008). Numbers are amino acid positions of N- and C-terminal ends of the helix, and arrow indicates the hydrophobic moment. (B) The hydrophobic stretch is required for Chm7 function in the context of NPC misassembly. 10-fold serial dilutions of the indicated strains with indicated CHM7 alleles plated and grown on YPD. (C) The hydrophobic stretch is required for the focal accumulation of Chm7 at the INM. Deconvolved fluorescence micrographs of Chm7-GFP and indicated chm7-GFP proteins (fluorescence inverted), dsRED-HDEL (demarking the NE/ER), and merged images in the LMB-sensitive strain (xpo1-T539C) after treatment with carrier (MeOH) or LMB. Arrowheads and arrows point to focal and evenly distributed nuclear rim GFP fluorescence, respectively, at the NE. Scale bar, 5 µm. On the right is a cartoon interpretation of Chm7 localization upon LMB-induced inhibition of Xpo1. The top of the diagram is the cytosol. (D) Plot of the percentage of cells where Chm7-GFP or the indicated chm7-GFP mutants accumulate at the NE after treatment with carrier (only wild type shown) and LMB. Average and SD are shown from three independent experiments where >50 cells were counted per replicate. P values are from a one-way ANOVA with multiple comparisons and Dunnett’s post hoc test calculated compared against controls treated with carrier alone, where ns (not significant) is P > 0.05; ****, P ≤ 0.0001. (E) The hydrophobic stretch is required for the Heh1/2-independent association of chm7-N with the NE. Deconvolved fluorescence micrographs of chm7-N-GFP, chm7-N-(W3AV1A)-GFP, or chm7-N-(K121A-K124A)-GFP (GFP signal inverted) in the indicated strains with Nup170-mCherry and merged images shown. Arrowheads and arrows point to focal and evenly distributed nuclear rim GFP fluorescence, respectively, at the NE. Asterisks indicate vacuolar autofluorescence. Scale bar, 5 µm. (F) Plot of the percentage of cells with mean and SD from three independent experiments with 50 cells/experiment counted with type I, type II, or type III chm7-N-GFP distributions as diagrammed in the classification scheme in G. (G) Cartoons of a phenotypic classification scheme to help interpret chm7-N-GFP subcellular distributions in E.

