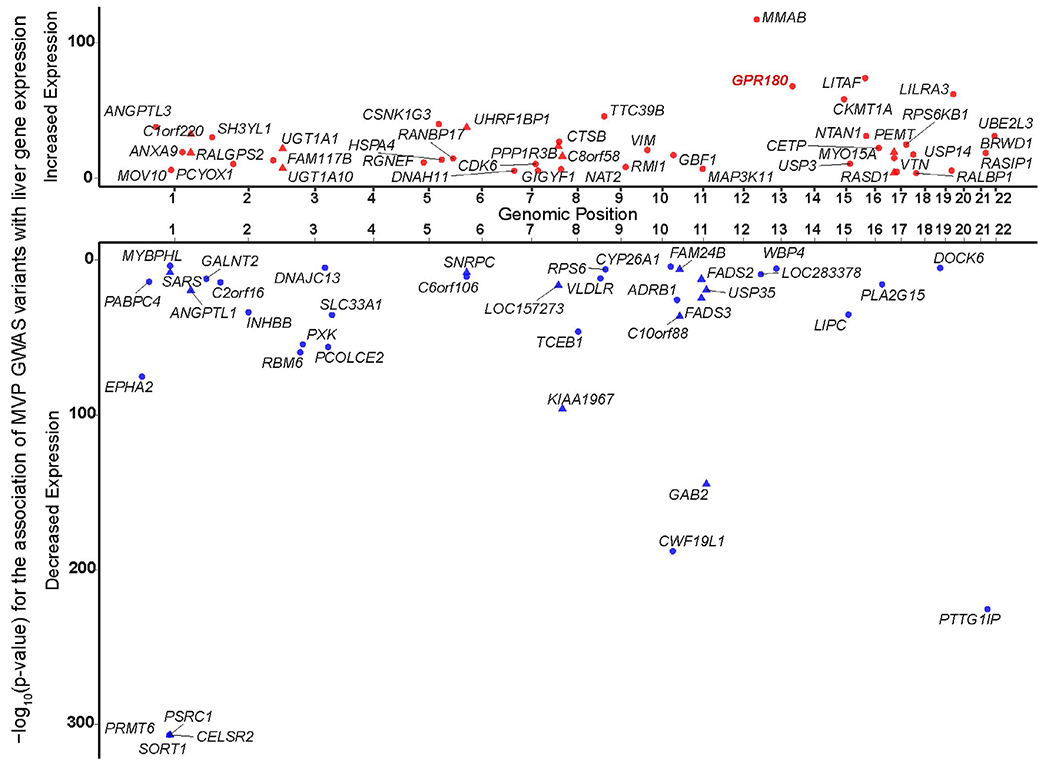
Figure 5.

Lipid GWAS (genome-wide association study) loci that have a colocalized liver cis-eQTL (expression quantitative trait locus). Symbols represent the lead variant from the MVP (Million Veteran Program) GWAS20 colocalized with an eQTL for the named gene. The x-axis shows chromosomal positions of the lead GWAS variants, and the y-axis shows the −log10 P values of the GWAS variant’s association with gene expression levels in liver. Increased (red) or decreased (blue) expression corresponds to the direction of association of the risk allele with the MVP GWAS lipid trait, where risk is defined as increased total cholesterol, LDL (low density lipoprotein), or triglycerides, or decreased HDL (high density lipoprotein). Triangles: GWAS variants that were colocalized with a cis-eQTL for more than one gene. Circles: variants that were colocalized with a single gene. Only the associations with false discovery rate < 0.01 are shown; full results can be found in Table S6.
