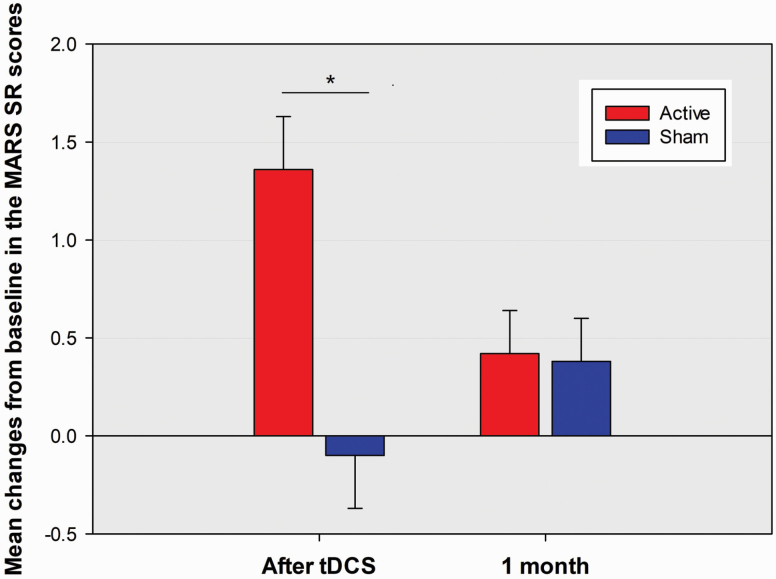
Figure 4.
Mean percentage changes from baseline in the subjective response to taking medication subscale score of Medication Adherence Rating Scale (MARS SR) between the active stimulation group and sham group at post-baseline assessments of immediately after stimulation and 1 month after stimulation. Other descriptions are as in Figure 3. *P < .0129.

