Figure 1.
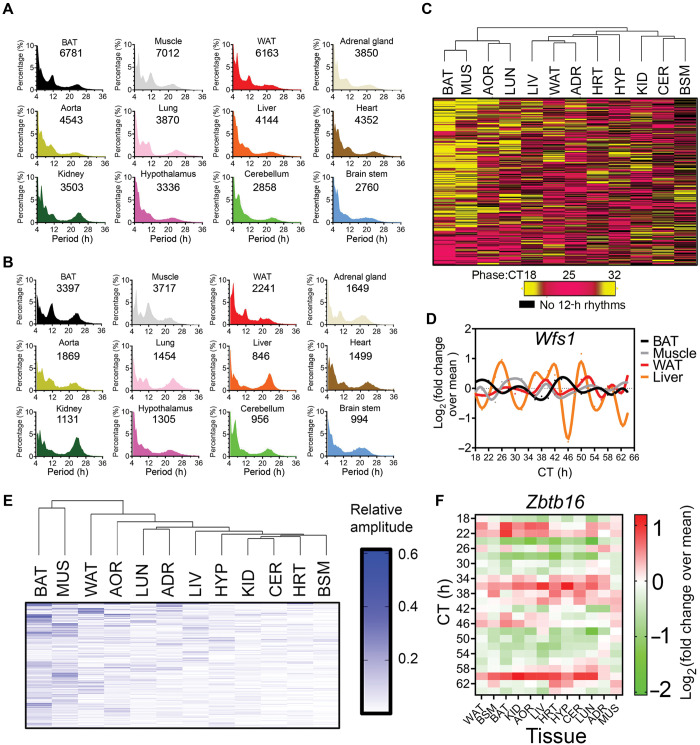
Prevalent 12-h rhythms of gene expression in mouse tissues. Eigenvalue/pencil method was applied to the microarray dataset reported in Zhang et al. (2014). The criterion for defining 12-h oscillation is previously described (Pan et al., 2020). (A and B) Period distribution of all (A) and dominant (B) oscillations uncovered in 12 tissues in mice. The number of ∼12-h oscillations in each tissue is shown. (C) Hierarchical clustering of the phases of 380 commonly found (in at least eight tissues) 12-h genes. (D) Wfs1 expression in four different tissues. (E) Hierarchical clustering of the relative amplitudes of 380 commonly found (in at least eight tissues) 12-h genes. (F) Heat map of Zbtb16 expression.

