
Figure 1.
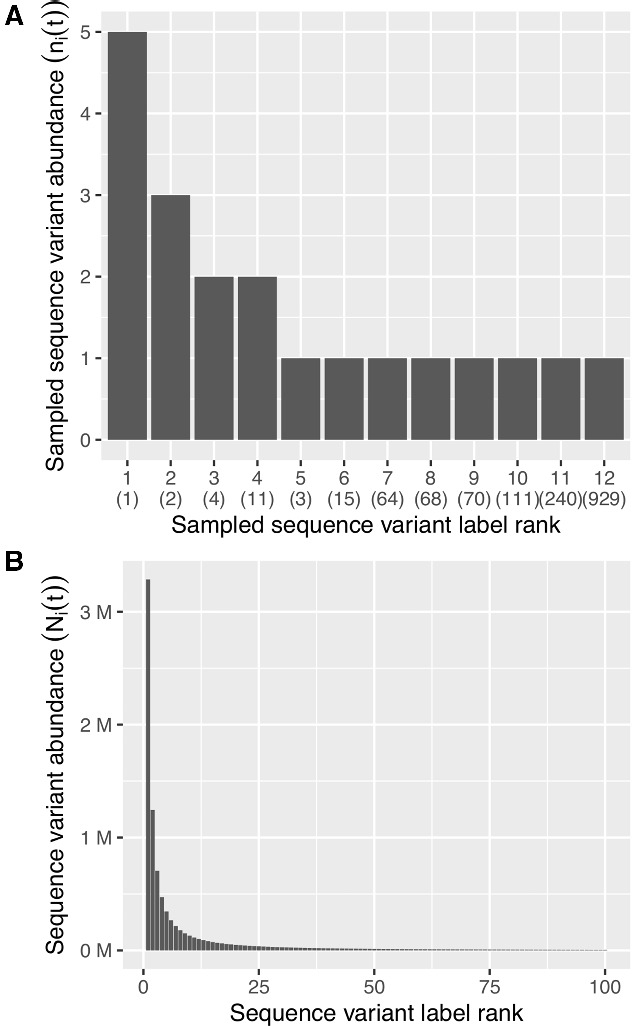
Sampling properties under a power-law model. (A) An example of an ordered histogram of n = 20 sequences sampled from a hypothetical reservoir population represented in (B). The true rank in the sequence population is displayed in brackets. (B) The power-law distribution of rank abundance for (replication-competent estimates in Reeves et al. (2018)) in a reservoir of 107 cells comprising 104 variants (only the first 100 ranks are displayed).