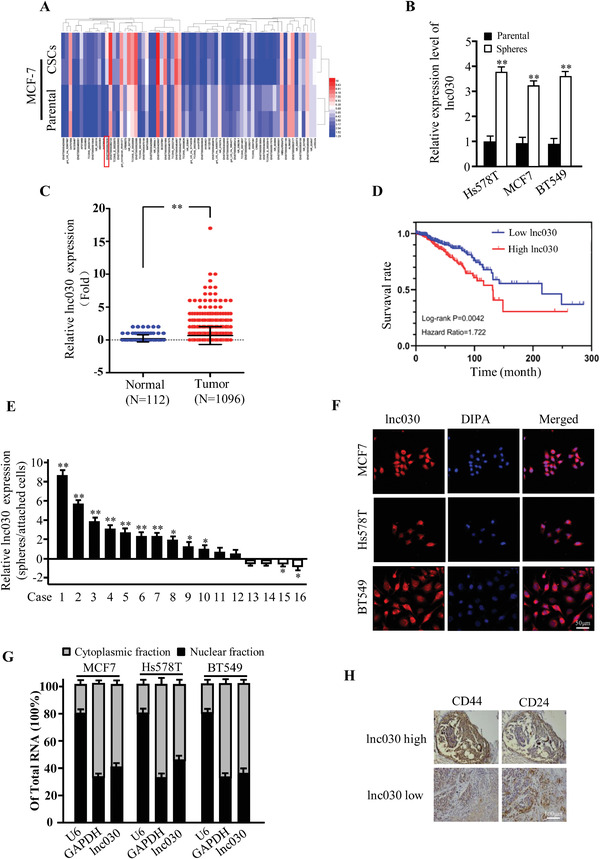
Figure 1.

Lnc030 is highly expressed in BCSCs. A) Heatmap of lncRNA expression profiles between MCF‐7 and BCSC derived from epithelial‐mesenchymal transited MCF‐7 (MCF‐7/BCSC) using microarray assay. B) Lnc030 levels were evaluated in spheres and their parental BC cells by real‐time PCR (**p < 0.01). C) High level of lnc030 in breast tumor tissues (n = 1096) compared in adjacent normal breast tissues (n = 112) was identified using TCGA database (**p < 0.01). D) High level of lnc030 was correlated with a poor survival rate in TCGA database. E) The relative fold of lnc030 were evaluated in spheres and attached cells derived from randomly selected breast tumors by real‐time PCR (n = 16) (*p < 0.05, **p < 0.01). F) Lnc030 intracellular localization was visualized in breast cancer cells by RNA‐FISH assays. Representative images of lnc030 in Hs578T, MCF‐7, and BT549 cells are shown. DAPI: 4’,6‐diamidino‐2‐phenylindole; the used probe: lnc030 (Scale bar, 50 µm). G) Lnc030 fractionation in different breast cancer cells was followed by qRT‐PCR. U6 RNA serves as a positive control for nuclear gene expression. GAPDH serves as a positive control for cytoplasmic gene expression. Data are shown as means ± SD (n = 3). H) Representative images of IHC staining for CD44 and CD24 in breast tumor tissues with high or low lnc030 expression (Scale bar, 100 µm).
