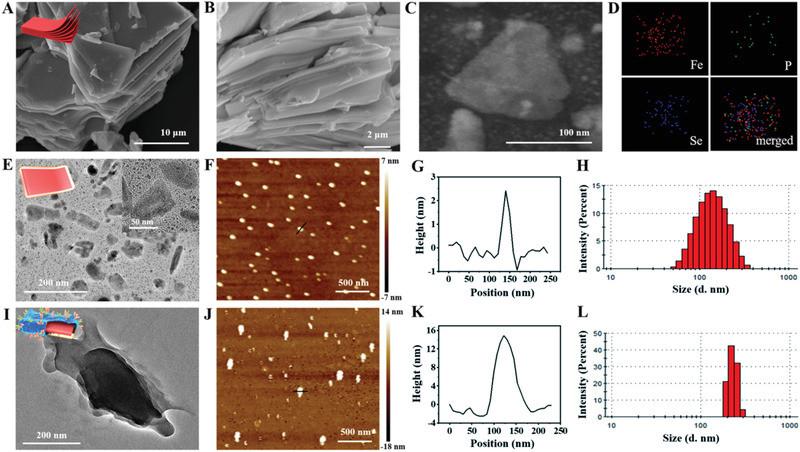
Figure 1.

A,B) SEM images of multilayer FePSe3 at different magnifications. C,D) Dark‐field TEM image of ultrathin FePSe3@CS NSs and the corresponding elemental mapping images. TEM images of E) FePSe3@CS and I) FePSe3@CCM NSs. AFM images and corresponding height analysis of F,G) FePSe3@CS NSs and J,K) FePSe3@CCM NSs. Size distribution of H) FePSe3@CS NSs and L) FePSe3@CCM NSs.
